pyecharts 1.0自定义配置项使用 自定义标签字体大小
pyecharts 1.0自定义配置项使用
之前用过pyecharts0.5,当时使用的感觉就是这个工具很简单方便,现在更新了V1版本,使用体验上是V1比V0.5稍微复杂了一点点,但是看明白以后可以看到V1增加了生成图的灵活性。
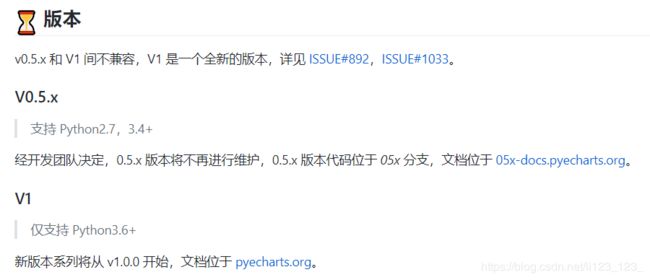
下面是官方对V0.5和V1的简单描述:

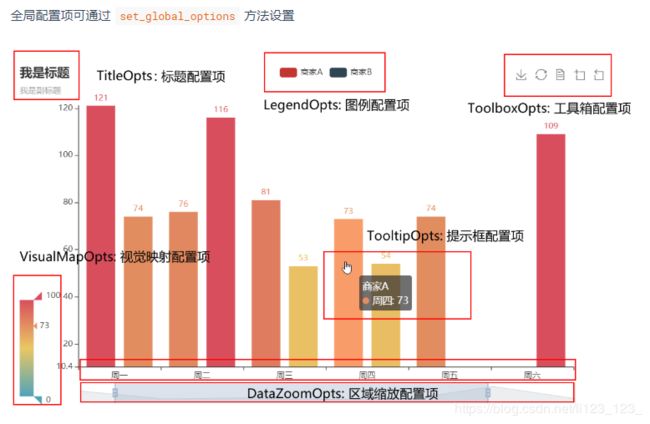
第二次使用pyecharts V1时,是将pyecharts和flask框架整合进行使用,遇到的一个问题是一时没有明白全局配置项的使用。
基本的使用官方都给出了使用案例。

这里的union和C语言中的union共用体是一个含义,及textstyle_opts可以是其中的一种。

自定义顶配项字体的大小的
例一:
def ber_analise() -> Bar:
    c2 = (
        Bar()
            .add_xaxis(['mean', 'std', 'min', '25%', '50%', '75%'],)
            .add_yaxis("专车", [63, 152, 11, 26, 50, 84], label_opts=opts.LabelOpts(font_size=20), itemstyle_opts=opts.ItemStyleOpts('rgb(51,75,92)'))
            .add_yaxis("快车", [20, 59, 9, 11.7, 16, 22], label_opts=opts.LabelOpts(font_size=20), itemstyle_opts=opts.ItemStyleOpts('rgb(194,53,49)'))
            .set_global_opts(title_opts=opts.TitleOpts(title="消费价格分析"),
                             xaxis_opts=opts.AxisOpts(axislabel_opts=opts.LabelOpts(font_size=20)),
                             legend_opts=opts.LegendOpts(textstyle_opts=opts.TextStyleOpts(font_size=20)))
            .set_series_opts(
            label_opts=opts.LabelOpts(is_show=False),
            markline_opts=opts.MarkLineOpts(
                data=[
                    opts.MarkLineItem(type_="min", name="最小值"),
                    opts.MarkLineItem(type_="max", name="最大值"),
                    opts.MarkLineItem(type_="average", name="平均值"),
                ]
            ),
        )
    )
    return c2
def bar_goOutNumberAndDistance() -> Bar:
    goOutNumberAndDistance = pd.read_csv('D:\lss\ccfData\HaiKouDeal\goOutNumberAndDistance.csv', index_col=None)
    day = goOutNumberAndDistance['day']
    month = goOutNumberAndDistance['month']
    count = goOutNumberAndDistance['count']
    sum = goOutNumberAndDistance['sum']
    dayAndMonth = []
    for i in range(len(count)):
        dayAndMonth.append(str(month[i])+','+str(day[i]))
    count = list(count)
    sum = list(sum)
    c = (
        Bar(
            init_opts=opts.InitOpts(
                animation_opts=opts.AnimationOpts(
                    animation_delay=100, animation_easing="elasticOut"
                )
            )
        )
        .add_xaxis(dayAndMonth)
        .add_yaxis("每日订单数量", count)
        .add_yaxis("日出行路程和", sum)
        .set_global_opts(title_opts=opts.TitleOpts(title="海口出行统计分析", subtitle="日订单数和总路程"),
                         datazoom_opts=[opts.DataZoomOpts(), opts.DataZoomOpts(type_="inside")],
                         legend_opts=opts.LegendOpts(textstyle_opts=opts.TextStyleOpts(font_size=20)),
                         xaxis_opts=opts.AxisOpts(axislabel_opts=opts.LabelOpts(font_size=15)),
                         )
        .set_series_opts(
            label_opts=opts.LabelOpts(is_show=False),
            markline_opts=opts.MarkLineOpts(
                data=[
                    opts.MarkLineItem(type_="min", name="最小值"),
                    opts.MarkLineItem(type_="max", name="最大值"),
                    opts.MarkLineItem(type_="average", name="平均值"),
                ]
            ),
        )
    )
    return c
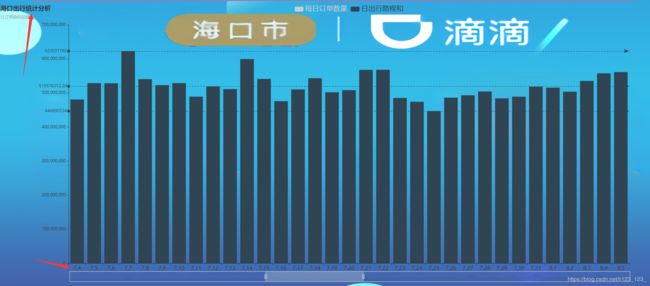
效果:

可以参考官方文档中的全局配置项和系列配置项进行个性化的设置。
图例配置项中此属性是来定义字体的类型的,可以用一个series_options.TextStyleOpts来定义,也可以通过一个字典来定义。
# 图例组件字体样式,参考 `series_options.TextStyleOpts`
    textstyle_opts: Union[TextStyleOpts, dict, None] = None,
可以看出V1的开放性要高于V0.5的。
