数据可视化(pyecharts 1.7.1)学习笔记——系列笔记(4)
四、Python数据分析库 - Pandas
1、Pandas数据结构Series对象
1)创建Series对象
Series保存的是一维带索引的数组
数组中的元素可以是任何数据类型,整数,字符串,浮点数,Python对象等
-
data,一维数组
- Numpy的ndarray对象
- 字典、列表等
- 一个数值,比如数字5
-
Index,每个元素的索引
- Series一维数组的每个元素都带有索引
- 如果不传入index参数,会自动为每个元素生产索引
# 导入pandas和numpy
import pandas as pd
import numpy as np
data = np.arange(1, 10)
index = np.arange(11, 20)
s = pd.Series(data, index=index)
s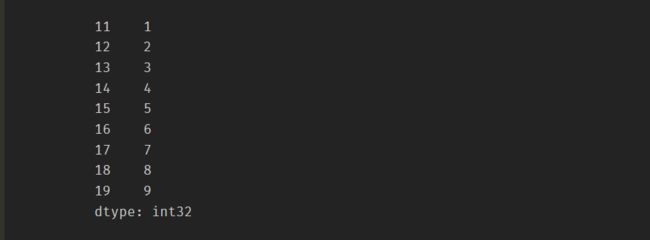
-
从Numpy的ndarray对象创建Series对象
-
用字典创建Series对象
-
用列表创建Series对象
2)操作Series对象
-
数字索引
-
index索引
s = pd.Series(np.random.rand(3), index=['a', 'b', 'c'])
print("s[0]:\n", s[0])
print("s['b']:\n", s['b'])
判断索引是否在索引列表中
-
In
-
直接访问一个不存在的索引会报KeyError错误
-
get函数
- 索引存在,则返回对应值
- 索引不在,无返回值
- 指定索引不存在的的返回值
print("'a' in s: \n", 'a' in s)
print("'f' in s: \n", 'f' in s)
try:
    print("s['f']: \n", s['f'])
except KeyError:
    print(KeyError)
print("s.get('b'): \n", s.get('b'))
print("s.get('f'):\n", s.get('f'))
print("s.get('f', 'f不在索引列表中'):\n", s.get('f', 'f不在索引列表中'))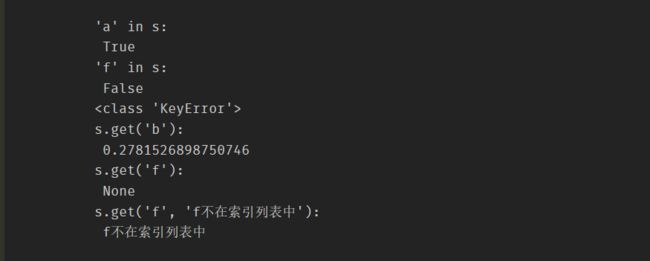
切片
-
分号分隔,截取部分子集
print("s[:3]:\n{}".format(s[:3]))
print("s[:'c']:\n{}".format(s[:'c']))
print("s[1:3]:\n{}".format(s[1:3]))
print("s[[1,2]]:\n{}".format(s[[1,2]]))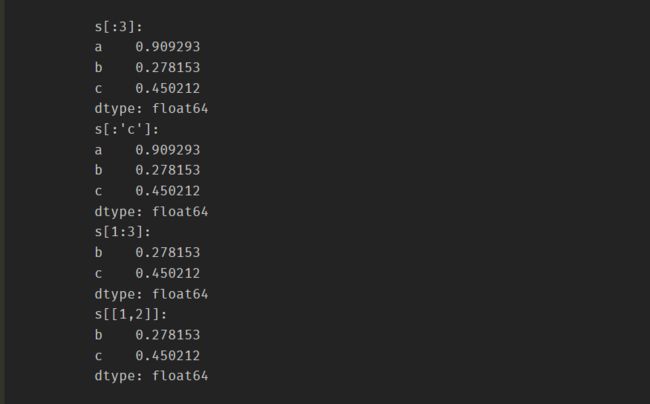
跟ndarray类似
- 进行向量化计算
- 加减乘除
- numpy的很多函数也能够作用于Series对象
- np.sqrt(s),np.square(s)
3)时间序列
-
Series对象最重要的功能是保存和处理时间序列数据
-
金融领域的数据一般都是时间序列数据
-
Pandas能够很好地支持时间序列数据
-
pandas的data_range函数创建一个时间序列
# 生成从2018年9月1日开始,十天的时间序列索引,频率为10分钟
rng = pd.date_range('9/1/2018', periods=1440, freq='10Min')
rng[:5]
-
创建Series对象,对应索引为时间序列
ts = pd.Series(np.random.rand(1440), index=rng)
ts.head()
ts.count()
-
切片的方式提取和访问数据
ts[:5]
ts[:10:2]
-
时间日期与切片结合的方式提取数据
# 时间字符串索引
ts['9/6/2018'][140:]
# datetime类型的索引
from datetime import datetime
ts[datetime(2018, 9, 9):][::60]
2、DataFrame对象的创建与保存
1)创建DataFrame对象
- DataFrame是一种带索引的二维数据结构
- 二维数据
- 二维列表
- ndarray对象
- 一维数据
- 一维列表
- 多个一维列表要求长度相同
- 组成一个字典
- Series对象
- 组成一个字典
- 一维列表
- 包含字典的列表
- 三维数据
- 可传入三维列表数据,但无法解析
- 不能传入ndarray三维数组
2)保存到文件数据库
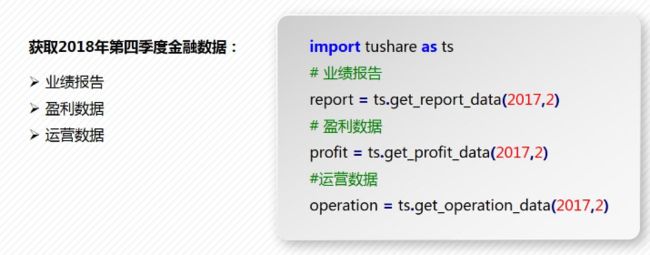
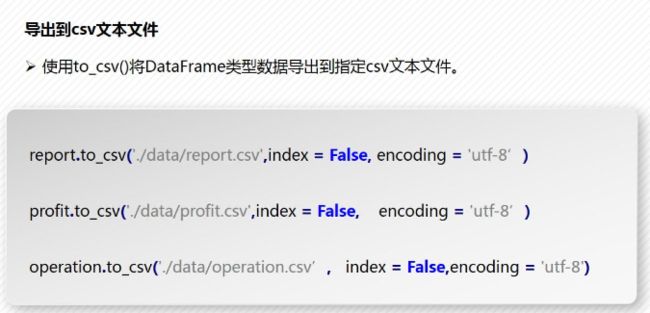
DataFrame数据导出到文件
-
Tushare是一个免费、开源的python财经数据接口包
-
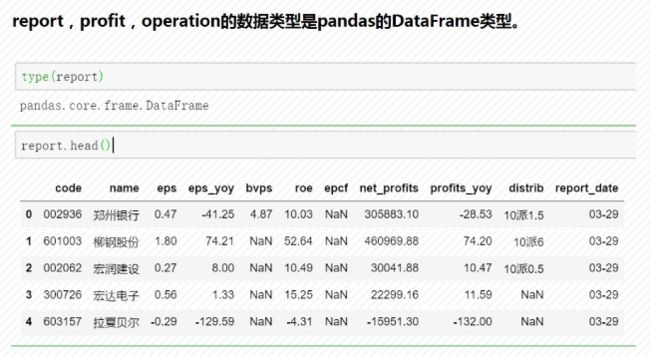
Tushare返回的绝大部分的数据格式都是pandas DataFrame类型,非常便于用pandas进行数据分析
-
安装:pip install tushare
-
官方文档:http://tushare.org/
-
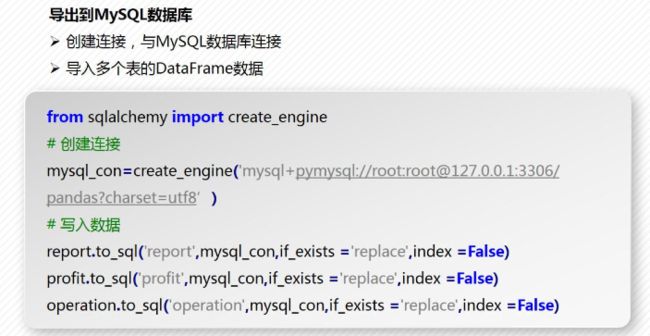
导出到MySQL数据库
3)读取文件/数据库
- 读取Excel、json文件
- read_excel()读取Excel文件数据
- Excel文件可以是包含单个表的文件
- Excel也可以是包含多个表的工作薄,这时需要指定工作表名称
- read_json()读取json文件内容
- 读取数据库table内的表
- 建立数据库连接
- read_sql()读取指定表的内容
3、DataFrame的数据操作
-
选择、添加与删除数据
- 选择行和列
- 添加新列
- 基于已有列添加新列
- 用标量赋值
- Series对象
- 指定列插入
- 删除列
- pop()删除指定列,返回指定列
- del 删除指定列,无返回值
-
分组计算与汇总
- 导入数据
- 按照条件对所有的数值型变量进行汇总
- 分组:groupby()
- 汇总:sum()
- 选择有现实意义的数值型变量进行汇总
- 添加变量的索引进行汇总
- 分组汇总单列数据
- mean()求平均值
- describe()进行描述性统计
- 多个分类变量对数据进行汇总
-
数据融合
-
merge()基于指定列进行连接
df1 = pd.DataFrame({'name': ['hellof', 'masonsxu', 'a', 'b', 'c']})
df2 = pd.DataFrame({'name': ['hellof', 'masonsxu', 'A', 'B', 'C']})
pd.merge(df1, df2, on='name')
-
inner内连接
pd.merge(df1, df2, how='inner')
-
left左连接
pd.merge(df1, df2, how='left')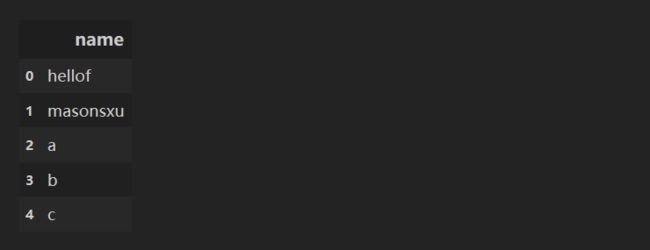
-
right右连接
pd.merge(df1, df2, how='right')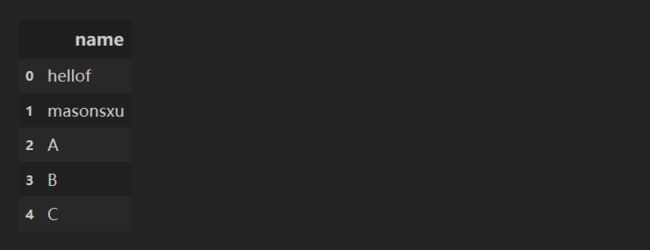
-
outer外连接
pd.merge(df1, df2, how='outer')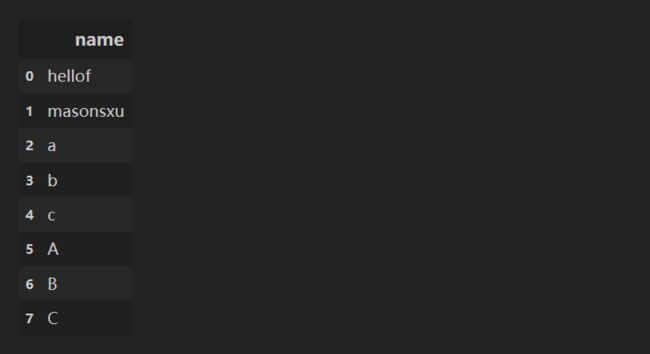
-
4、比例数据可视化实验
实验环境
- jupyter=1.0.0
- notebook=6.0.3
- pyecharts=1.7.1
- python=3.7.6
- pandas=1.0.1
导入本次实验所需要的相应模块
from pyecharts.globals import CurrentConfig, NotebookType
CurrentConfig.NOTEBOOK_TYPE = NotebookType.JUPYTER_NOTEBOOK

import pyecharts.options as opts
from pyecharts.globals import ThemeType
-
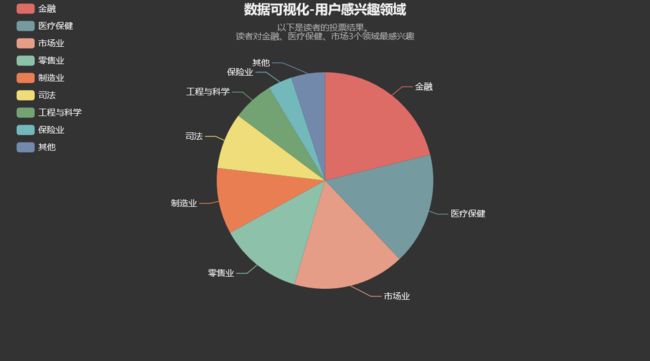
饼状图
from pyecharts.charts import Pie vote_result = pd.read_csv('data/vote_result.csv') pie = ( Pie(init_opts=opts.InitOpts(theme=ThemeType.DARK)) .add('领域名称', [list(z) for z in zip(vote_result['Areas_of_interest'].tolist(), vote_result['Votes'].tolist())], radius=[None, 150], tooltip_opts=opts.TooltipOpts(textstyle_opts=opts.TextStyleOpts(align='center'), formatter='{a}'+'
'+'{b}: {c} ({d}%)')) .set_global_opts(title_opts=opts.TitleOpts(title="数据可视化-用户感兴趣领域", subtitle="以下是读者的投票结果。\n读者对金融、医疗保健、市场3个领域最感兴趣", pos_left='center'), legend_opts=opts.LegendOpts(orient="vertical", pos_left="2%") ) .set_series_opts(label_opts=opts.LabelOpts(formatter='{b}')) ) pie.render_notebook() -
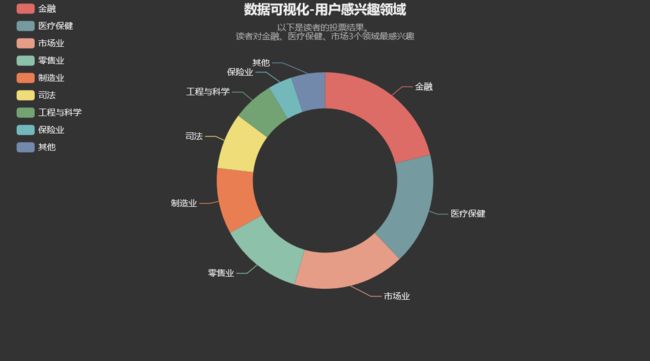
环形图
pie = ( Pie(init_opts=opts.InitOpts(theme=ThemeType.DARK)) .add('领域名称', [list(z) for z in zip(vote_result['Areas_of_interest'].tolist(), vote_result['Votes'].tolist())], radius=[100, 150], tooltip_opts=opts.TooltipOpts(textstyle_opts=opts.TextStyleOpts(align='center'), formatter='{a}'+'
'+'{b}: {c} ({d}%)')) .set_global_opts(title_opts=opts.TitleOpts(title="数据可视化-用户感兴趣领域", subtitle="以下是读者的投票结果。\n读者对金融、医疗保健、市场3个领域最感兴趣", pos_left='center'), legend_opts=opts.LegendOpts(orient="vertical", pos_left="2%") ) .set_series_opts(label_opts=opts.LabelOpts(formatter='{b}')) ) pie.render_notebook() -
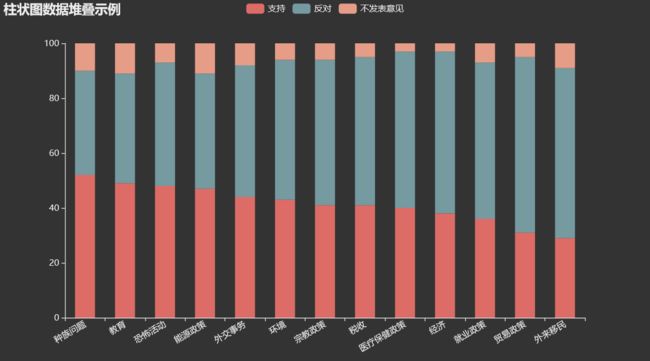
柱状堆叠图1
from pyecharts.charts import Bar pre_approval_rate = pd.read_csv('data/presidential_approval_rate.csv') bar = ( Bar(init_opts = opts.InitOpts(theme = ThemeType.DARK)) .add_xaxis(pre_approval_rate['political_issue'].tolist()) .add_yaxis("支持", pre_approval_rate['support'].tolist(), stack="1", category_gap="50%") .add_yaxis("反对", pre_approval_rate['oppose'].tolist(), stack="1", category_gap="50%") .add_yaxis("不发表意见", pre_approval_rate['no_opinion'].tolist(), stack="1", category_gap="50%") .set_series_opts(label_opts=opts.LabelOpts(is_show=False)) .set_global_opts(title_opts=opts.TitleOpts(title = "柱状图数据堆叠示例"), xaxis_opts=opts.AxisOpts(axislabel_opts=opts.LabelOpts(rotate=30))) ) bar.render_notebook() -
柱状堆叠图2
list_support = ['支持', '反对', '不发表意见'] bar = Bar(init_opts = opts.InitOpts(theme = ThemeType.DARK)) bar.add_xaxis(list_support) for i in range(pre_approval_rate.iloc[:,0].size): issue = pre_approval_rate.loc[i,'political_issue'] bar.add_yaxis(issue, [int(x) for x in pre_approval_rate.loc[i,['support','oppose','no_opinion']]], stack="1", category_gap="50%") bar.set_series_opts(label_opts=opts.LabelOpts(is_show=False)) bar.set_global_opts(title_opts=opts.TitleOpts(title = "柱状图数据堆叠示例", pos_left='center'), legend_opts=opts.LegendOpts(orient="vertical", pos_right="2%")) bar.render_notebook() -
树图
import os import json import codecs from pyecharts.charts import Tree with codecs.open(os.path.join('data', 'GDP_data.json'), 'r', encoding='utf8') as f: j = json.load(f) data = [j] tree = ( Tree(init_opts=opts.InitOpts(theme=ThemeType.DARK)) .add("", data) .set_global_opts(title_opts=opts.TitleOpts(title="树图")) ) tree.render_notebook() -
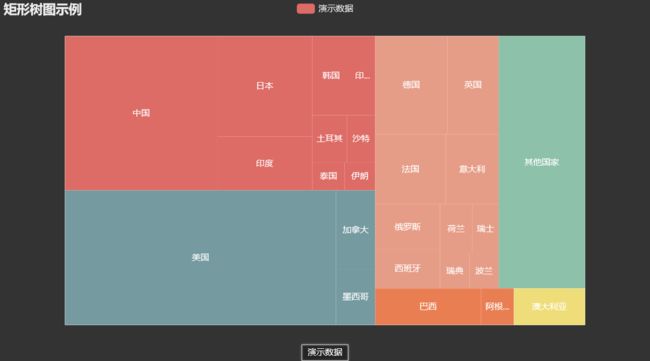
矩形树图示例
from pyecharts.charts import TreeMap with open(os.path.join('data', 'GDP_data_1.json'), 'r', encoding='utf8') as f: data = json.load(f) treemap = ( TreeMap(init_opts=opts.InitOpts(theme=ThemeType.DARK)) .add("演示数据", data) .set_series_opts(label_opts=opts.LabelOpts(is_show=True, position='inside')) .set_global_opts(title_opts=opts.TitleOpts(title="矩形树图示例")) ) treemap.render_notebook() -
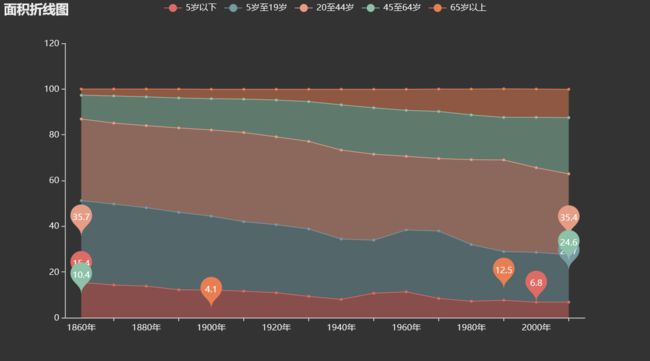
面积折线图
from pyecharts.charts import Line

year_population_age = pd.read_csv('data/us_population_by_age.csv')

line3 = (
    Line(init_opts=opts.InitOpts(theme=ThemeType.DARK))
    .add_xaxis(year_population_age['year'].tolist())
    .add_yaxis('5岁以下', year_population_age['year_under5'].tolist(), color='red',
               stack='1')
    .add_yaxis('5岁至19岁', year_population_age['year5_19'].tolist(), color='blue',
               stack='1')
    .add_yaxis('20至44岁', year_population_age['year20_44'].tolist(), color='green',
               stack='1')
    .add_yaxis('45至64岁', year_population_age['year45_64'].tolist(), color='yellow',
              stack='1')
    .add_yaxis('65岁以上', year_population_age['year65above'].tolist(), color='orange',
               stack='1')
    .set_series_opts(areastyle_opts=opts.AreaStyleOpts(opacity=0.5),
                     label_opts=opts.LabelOpts(is_show=False),
                     markpoint_opts=opts.MarkPointOpts(data=[opts.MarkPointItem(type_='max'),
                                                             opts.MarkPointItem(type_='min')],
                                                       symbol='pin'))
    .set_global_opts(title_opts=opts.TitleOpts(title='面积折线图'))
)
line3.render_notebook()


