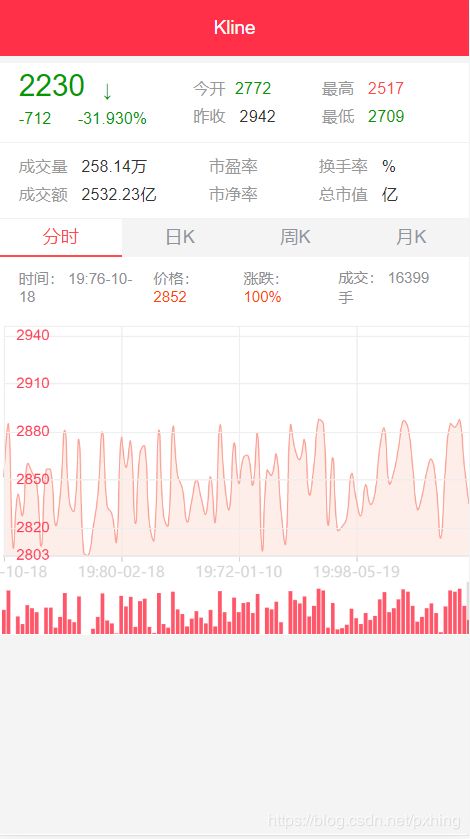
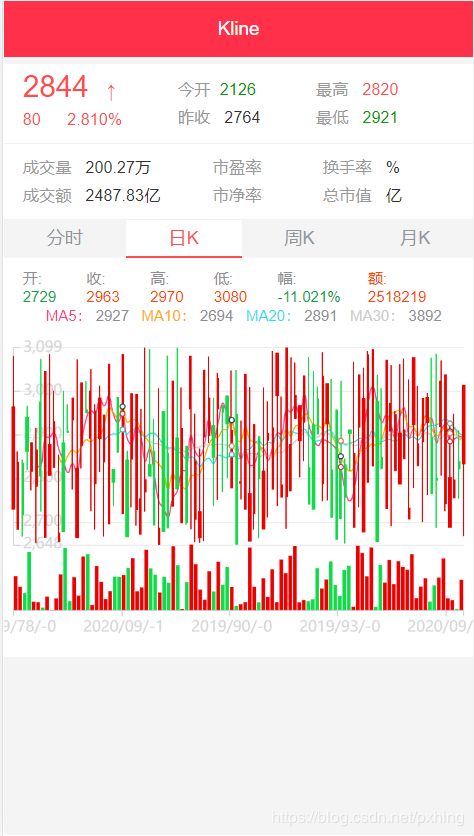
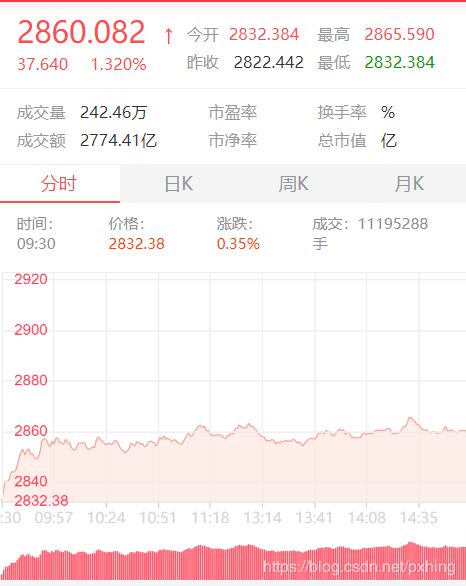
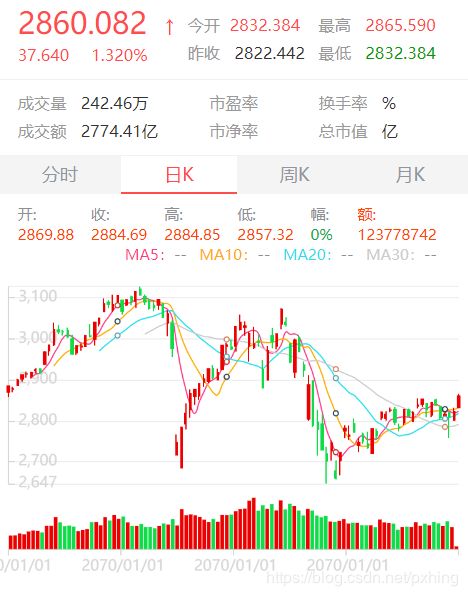
Vue使用echarts图表实现k线图(分K,日K,周K,月K)
前言:
因为K线图需要庞大的数据,这里我用的是mock.js随机产生的数据,效果相对后台反给的数据来说波动比较大。
一,安装安装 ECharts
npm install echarts --save / cnpm install echarts --save
二,vue中使用
import echarts from 'echarts'

Vue.prototype.$echarts = echarts
三,开始封装k线
先在自己的页面选择好自己的容器,定义好大小
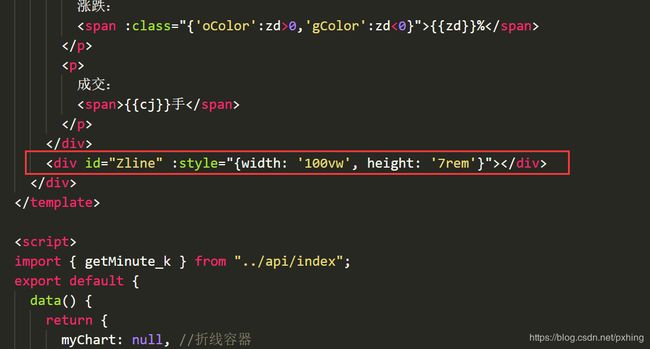
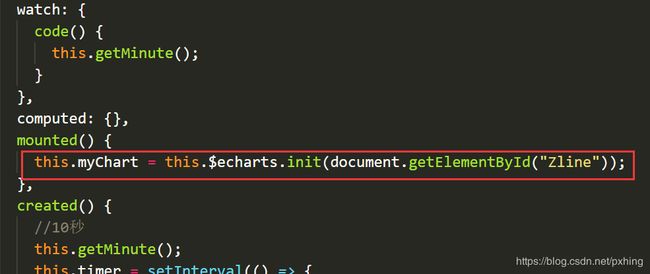
数据加载完之后获取容器
封装getMinute()方法进行数据请求封装,里面的getMinute_k(),是我自己用mock.js模拟的数据进行的封装
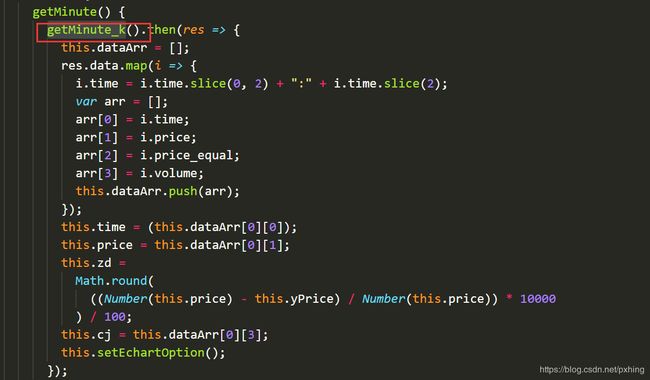
如果有后台的话,直接请求接口,替换掉getMinute_k()方法,如图:

调用的setEchartOption()方法
setEchartOption() {
      let that = this;
      var option = null;
      that.myChart.setOption(
        (option = {
          animation: false,
          tooltip: {
            trigger: "axis",
            position: function(pt) {
              return [pt[0], "10%"];
            },
            formatter: function(params) {
              that.time = params[0].value[0];
              that.price = params[0].value[1];
              that.zd =
                Math.round(
                  (Number(params[0].value[1] - that.yPrice) /
                    Number(params[0].value[1])) *
                    10000
                ) / 100;
              that.cj = params[0].value[3];
            }
          },
          grid: [
            {
              left: "3",
              right: "0",
              top: "6%",
              height: "70%"
            },
            {
              left: "3",
              right: "0",
              top: "84%",
              height: "18%"
            }
          ],
          xAxis: [
            {
              type: "category",
              boundaryGap: false,
              splitLine: {
                show: true,
                lineStyle: {
                  color: "#eee"
                }
              },
              axisLine: {
                lineStyle: {
                  color: "#D6D6D6"
                }
              }
            },
            {
              type: "category",
              gridIndex: 1,
              scale: true,
              boundaryGap: false,
              axisLine: { lineStyle: { color: "#777" } },
              splitNumber: 20,
              axisPointer: {
                type: "shadow",
                label: { show: false },
                triggerTooltip: true,
                handle: {
                  show: true,
                  margin: 30,
                  color: "#D6D6D6"
                }
              }
            }
          ],
          yAxis: [
            {
              min: function(value) {
                return Math.round(value.min * 100) / 100;
              },
              max: function(value) {
                return Math.round(value.max * 1.02 * 100) / 100;
              },
              type: "value",
              position: "left",
              zlevel: 1,
              axisLabel: {
                fontSize: 12,
                fontFamily: "Arial",
                margin: 10,
                inside: true,
                formatter: function(params) {
                  return params;
                }
              },
              axisLine: {
                show: true,
                lineStyle: {
                  width: 1,
                  color: function(v) {
                    if (v == that.yPrice) {
                      return "#A5A5A8";
                    } else if (v < that.yPrice) {
                      return "#12E313";
                    } else {
                      return "#FF3B52";
                    }
                  }
                }
              },
              axisTick: {
                show: false
              },
              margin: 1,
              splitLine: {
                lineStyle: {
                  color: "#eee"
                },
                show: true
              },
              axisPointer: {
                show: true,
                type: "line",
                snap: true,
                label: {
                  precision: 2
                }
              }
            },
            {
              scale: true,
              gridIndex: 1,
              splitNumber: 2,
              axisLabel: { show: false },
              axisLine: { show: false },
              axisTick: { show: false },
              splitLine: { show: false }
            }
          ],
          dataZoom: [
            {
              type: "inside",
              start: 0,
              end: 100,
              zoomOnMouseWheel: false,
              moveOnMouseMove: false
            }
          ],
          series: [
            {
              name: "Volume", //柱状
              type: "bar",
              // barWidth:1,
              xAxisIndex: 1,
              yAxisIndex: 1,
              itemStyle: {
                color: function(v) {
                  // console.log(v)
                  if (v.value[1] == v.value[2]) {
                    return "#A5A5A8";
                  } else if (v.value[1] < v.value[2]) {
                    return "#63F763";
                  } else {
                    return "#FF576A";
                  }
                }
              },
              emphasis: {
                itemStyle: {
                  color: "#140"
                }
              },
              data: this.dataArr
            },
            {
              name: "",
              type: "line",
              smooth: true,
              symbol: "none",
              sampling: "average",
              itemStyle: {
                normal: {
                  color: "#FDE7E1",
                  lineStyle: {
                    color: "#FAA296",
                    width: 1
                  }
                }
              },
              areaStyle: {},
              data: this.dataArr
            }
          ]
        }),
        true
      );
    }
mock.js实现过程:(如果有后台,下面步骤即可省略)
安装mockjs
npm install mockjs --save-dev
main.js引入
require('./mock.js')
先自定义100条数据,随机变化(mock.js位置看你心情,我是和main.js同级)
//添加一个mock规则
const Mock = require('mockjs')


//获取mock.random对象
const Random = Mock.Random

// kline模拟数据
const getMinute_k = function () {
  let data = [];
  for (let i = 0; i < 100; i++) {
    let newArticleObject = {
      id: i,
      close: Random.natural(2800, 2888),
      high: Random.natural(2800, 2888),
      low: Random.natural(2800, 2888),
      ma5: Random.natural(2800, 2888),
      ma10: Random.natural(2800, 2888),
      ma20: Random.natural(2800, 2888),
      ma30: Random.natural(2800, 2888),
      open: Random.natural(2800, 2888),
      price: Random.natural(2800, 2888),
      price_equal: Random.natural(1000, 2000),
      time: Random.date(),
      volume: Random.natural(10000, 20000),
      yesterday_close: Random.natural(2800, 2888),
    }
    data.push(newArticleObject)
  }
  return {
    data: data
  }
}

Mock.mock('/index/minute_k', 'post', getMinute_k); // kline模拟数据
然后在src里面新建了一个api文件夹里面index.js封装get请求或者post请求用于对接数据,有后台的情况下,这些东西可以直接省略
import instance from "../until/axios"

//请求mock的数据
export function getMinute_k() {
    return new Promise((resolve,reject)=>{
        instance({
            url: "/index/minute_k",
            method: "post"
        }).then(response=>{
            resolve(response.data)
        }).catch(err=>{
            reject(err)
        })
    })
}
全部代码:
<template>
  <div>
    <div class="flex kData">
      <p>
        时间:
        <span>{{time}}</span>
      </p>
      <p>
        价格:
        <span :class="{'oColor':price>yPrice,'gColor':price>{{price}}</span>
      </p>
      <p>
        涨跌:
        <span :class="{'oColor':zd>0,'gColor':zd<0}">{{zd}}%</span>
      </p>
      <p>
        成交:
        <span>{{cj}}手</span>
      </p>
    </div>
    <div id="Zline" :style="{width: '100vw', height: '7rem'}"></div>
  </div>
</template>

<script>
import { getMinute_k } from "../api/index";
export default {
  data() {
    return {
      myChart: null, //折线容器
      time: "",
      price: "--",
      zd: "--",
      cj: "",
      yPrice: this.$store.state.yPrice,
      timer: null,
      dataArr: []
    };
  },
  watch: {
    code() {
      this.getMinute();
    }
  },
  computed: {},
  mounted() {
    this.myChart = this.$echarts.init(document.getElementById("Zline"));
  },
  created() {
    //10秒
    this.getMinute();
    this.timer = setInterval(() => {
      this.getMinute();
    }, 10000);
  },
  destroyed() {
    clearInterval(this.timer);
  },
  methods: {
    getMinute() {
      getMinute_k().then(res => {
        this.dataArr = [];
        res.data.map(i => {
          i.time = i.time.slice(0, 2) + ":" + i.time.slice(2);
          var arr = [];
          arr[0] = i.time;
          arr[1] = i.price;
          arr[2] = i.price_equal;
          arr[3] = i.volume;
          this.dataArr.push(arr);
        });
        this.time = (this.dataArr[0][0]);
        this.price = this.dataArr[0][1];
        this.zd =
          Math.round(
            ((Number(this.price) - this.yPrice) / Number(this.price)) * 10000
          ) / 100;
        this.cj = this.dataArr[0][3];
        this.setEchartOption();
      });
    },
    setEchartOption() {
      let that = this;
      var option = null;
      that.myChart.setOption(
        (option = {
          animation: false,
          tooltip: {
            trigger: "axis",
            position: function(pt) {
              return [pt[0], "10%"];
            },
            formatter: function(params) {
              that.time = params[0].value[0];
              that.price = params[0].value[1];
              that.zd =
                Math.round(
                  (Number(params[0].value[1] - that.yPrice) /
                    Number(params[0].value[1])) *
                    10000
                ) / 100;
              that.cj = params[0].value[3];
            }
          },
          grid: [
            {
              left: "3",
              right: "0",
              top: "6%",
              height: "70%"
            },
            {
              left: "3",
              right: "0",
              top: "84%",
              height: "18%"
            }
          ],
          xAxis: [
            {
              type: "category",
              boundaryGap: false,
              splitLine: {
                show: true,
                lineStyle: {
                  color: "#eee"
                }
              },
              axisLine: {
                lineStyle: {
                  color: "#D6D6D6"
                }
              }
            },
            {
              type: "category",
              gridIndex: 1,
              scale: true,
              boundaryGap: false,
              axisLine: { lineStyle: { color: "#777" } },
              splitNumber: 20,
              axisPointer: {
                type: "shadow",
                label: { show: false },
                triggerTooltip: true,
                handle: {
                  show: true,
                  margin: 30,
                  color: "#D6D6D6"
                }
              }
            }
          ],
          yAxis: [
            {
              min: function(value) {
                return Math.round(value.min * 100) / 100;
              },
              max: function(value) {
                return Math.round(value.max * 1.02 * 100) / 100;
              },
              type: "value",
              position: "left",
              zlevel: 1,
              axisLabel: {
                fontSize: 12,
                fontFamily: "Arial",
                margin: 10,
                inside: true,
                formatter: function(params) {
                  return params;
                }
              },
              axisLine: {
                show: true,
                lineStyle: {
                  width: 1,
                  color: function(v) {
                    if (v == that.yPrice) {
                      return "#A5A5A8";
                    } else if (v < that.yPrice) {
                      return "#12E313";
                    } else {
                      return "#FF3B52";
                    }
                  }
                }
              },
              axisTick: {
                show: false
              },
              margin: 1,
              splitLine: {
                lineStyle: {
                  color: "#eee"
                },
                show: true
              },
              axisPointer: {
                show: true,
                type: "line",
                snap: true,
                label: {
                  precision: 2
                }
              }
            },
            {
              scale: true,
              gridIndex: 1,
              splitNumber: 2,
              axisLabel: { show: false },
              axisLine: { show: false },
              axisTick: { show: false },
              splitLine: { show: false }
            }
          ],
          dataZoom: [
            {
              type: "inside",
              start: 0,
              end: 100,
              zoomOnMouseWheel: false,
              moveOnMouseMove: false
            }
          ],
          series: [
            {
              name: "Volume", //柱状
              type: "bar",
              // barWidth:1,
              xAxisIndex: 1,
              yAxisIndex: 1,
              itemStyle: {
                color: function(v) {
                  // console.log(v)
                  if (v.value[1] == v.value[2]) {
                    return "#A5A5A8";
                  } else if (v.value[1] < v.value[2]) {
                    return "#63F763";
                  } else {
                    return "#FF576A";
                  }
                }
              },
              emphasis: {
                itemStyle: {
                  color: "#140"
                }
              },
              data: this.dataArr
            },
            {
              name: "",
              type: "line",
              smooth: true,
              symbol: "none",
              sampling: "average",
              itemStyle: {
                normal: {
                  color: "#FDE7E1",
                  lineStyle: {
                    color: "#FAA296",
                    width: 1
                  }
                }
              },
              areaStyle: {},
              data: this.dataArr
            }
          ]
        }),
        true
      );
    }
  }
};
</script>

<style scoped lang="scss">
.flex {
  display: flex;
  align-items: center;
}

.kData {
  padding: 0 0.4rem;

  p {
    margin-right: 0.266666rem;
  }

  color: rgb(142, 142, 147);

  .oColor {
    color: rgb(255, 69, 0);
  }

  .gColor {
    color: rgb(5, 170, 59);
  }

  .pColor {
    color: rgb(255, 62, 139);
  }

  .yColor {
    color: rgb(255, 172, 0);
  }

  .bColor {
    color: rgb(39, 224, 239);
  }
}
</style>
这里展示仅为分K的代码,如果只展示一个K线这个即可,如果需要更多,可去GitHub下载代码
地址: https://github.com/pxhing/kline.
