案例:北京房价分析
背景/分析目的:了解北京房价总体情况,为买房做指导
用到的方法:
查看前几行数据:head
描述性分析:describe
计算数量:count
查看有没有重复值:duplicated
计算指定维度数据量:value_counts
字符型数据转为日期型:to_datetime
查看数据类型:dtypes
删除过滤:drop
查看空值:isnull
分组:groupby
按照索引排序:sort_index
区间划分:cut(arange基础上)
1、引入需要的库
import pandas as pd
import numpy as np
import matplotlib.pyplot as plt
2、加载数据文件
df = pd.read_csv('./beijing_houst_price.csv',dtype={'id':'str','livingRoom':'str','bathRoom':'str'})
3、查看文件
df.head()
tradeTime:交易日期
followers:关注人数
totalPrice:总价
price:单价(平米)
square:面积
livingRoom:卧室数量
drawingRoom:客厅数量
kitchen:厨房数量
bathRoom:浴室数量
floor:楼层
buildingType:房子类型
buildingStructure:建筑结构
ladderRatio:梯子比率
elevator:是否有电梯
fiveYearsProperty:是否满五年
subway:是否有地铁
district:所在区
communityAverage:所在小区价格
4、数值类列的常⽤统计值
df.describe()
followers关注度最小值为0,可能因为价格太高没人关注,
总价totalPrice:最小值0.1万才1000块钱,这肯定是有问题的,所有要进行处理一下。
单价price:最小值1也是有问题的。
面积square,6.9是正常的。
没有厨房kitchen也没有问题。
处理数据分析宗旨:分析什么清洗什么,需要什么处理什么。不需要的数据无需处理。对于数值型查看有没有异常值,对于字符型查看有没有null值。
数据清洗:
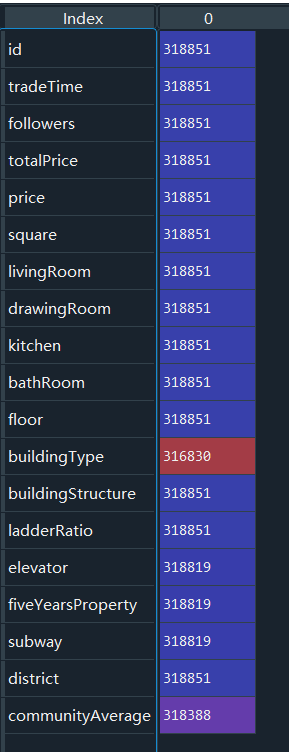
5、查看各列⾮空值数量
df.count()
6、查看ID有没有重复值
因为每套房源都是独立存在的,所以要查看下ID有没有重复值。
df[df['id'].duplicated()]
7、tradeTime列数据清洗,每个日期的数量
df['tradeTime'].value_counts()

年份跨度⽐较⼤,有些年份可能数据⽐较少。
看下每年数据的数量,确定是否要删除数据少的年份。
8、首先,先将字符串转为⽇期格式,⽅便使⽤内置函数
df['tradeTime'] = pd.to_datetime(df['tradeTime'])
使用pandas中的 to_datetime 方法转换为日期格式。
9、查看下数据类型
df.dtypes
10、统计下每年的数据量
df['tradeTime'].dt.year.value_counts()
dt 就是datetime,year就是取年,也可以取月或者日。
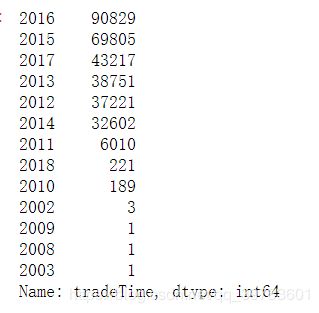
其他年份数据太少了,例如像2002年只有3条,2009年、2008年和2003年这些年只有1条数据。
11、我们只统计2012年~2017年的数据
我们用 drop 过滤一下。过滤掉2012年之前和2017年之后的数据。
df.drop(df[df['tradeTime'].dt.year < 2012].index, inplace=True)
df.drop(df[df['tradeTime'].dt.year > 2017].index, inplace=True)
12、在看下每年的数据量
df['tradeTime'].dt.year.value_counts()
13、totalPrice总价清洗
假如我不需要总价在50万以下的房子,或者我觉得50万以下的房子是不正常的,那么我需要对50万以下的房子做处理。
df[df['totalPrice'] < 50]
14、删除50万以下的房子
df.drop(df[df['totalPrice'] < 50].index, inplace=True)
再查看下:
df.describe()

总价最小值是50万,说明我们清洗成功了。
square列看最⼤值最⼩值,都是合理的,⽽且没有空值,所以不⽤清洗
communityAverage最⼤值最⼩值合理,不过有空值,需要处理下
15、查看communityAverage为null的数据
df[df['communityAverage'].isnull()]
16、删除communityAverage的空值(也可以使⽤平均值填充)
df.drop(df[df['communityAverage'].isnull()].index, inplace=True)
数据分析:
1、常⽤统计值
df.describe()
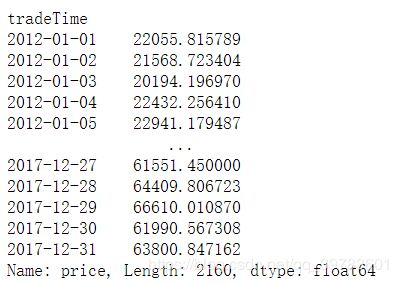
2、 统计每⽇所有房源的平均单价
df_price = df.groupby('tradeTime').mean()['price']
3、按照索引排序:
df_price.sort_index(inplace=True)
4、以2017年为例,看下2017年的数据
df['year'] = df['tradeTime'].dt.year
df_2017 = df[df['year'] == 2017]
df_2017
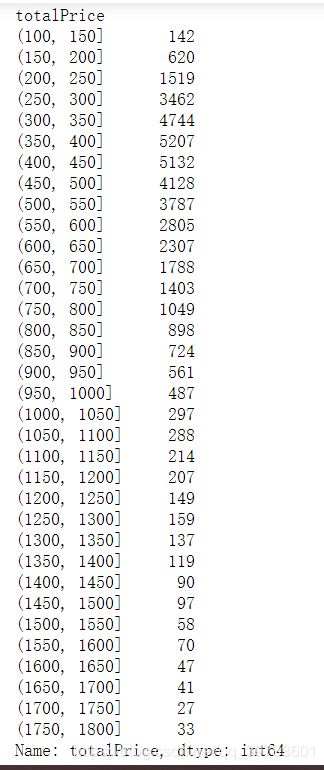
5、2017年总价各区间房源数
df_2017 = df[df['year'] == 2017]
bins_arr = np.arange(100, 1850, 50)
bins = pd.cut(df_2017['totalPrice'], bins_arr)
bin_counts = df_2017['totalPrice'].groupby(bins).count()
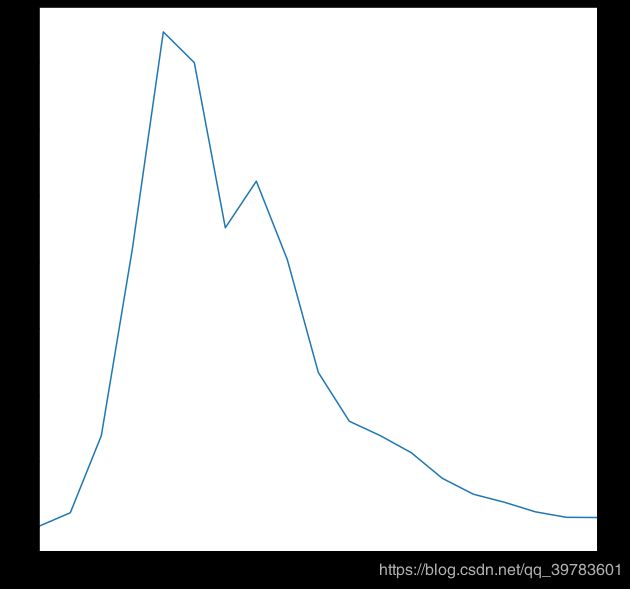
bin_counts.plot()
6、总价在300万~500万的房源占⽐
len(df_2017[(df_2017['totalPrice'] > 300) & (df_2017['totalPrice'] < 500)]) / len(df_2017)
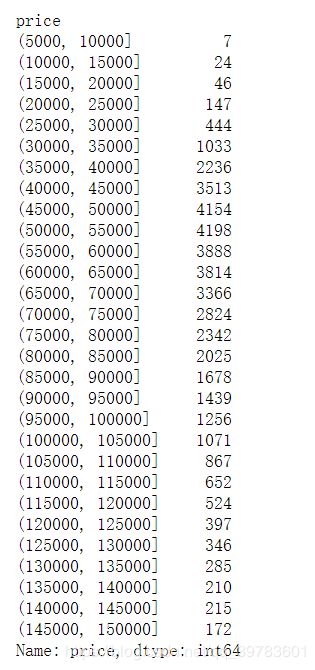
7、均价各区间房源数
bins_arr = np.arange(5000, 155000, 5000)
bins = pd.cut(df_2017['price'], bins_arr)
price_count = df_2017['price'].groupby(bins).count()
price_count
8、2017年单价在4万~7万的房源占⽐
len(df_2017[(df_2017['price'] > 40000) & (df_2017['price'] < 70000)]) / len(df_2017)
9、2017年⾯积各区间房源数
bins_arr = np.arange(10, 210, 10)
bins = pd.cut(df_2017['square'], bins_arr)
square_count = df_2017['square'].groupby(bins).count()
square_count
plt.figure(figsize=(10,10))
square_count.plot()


