R语言基础
文章目录
- 简单函数
- 数据类型
- 向量
- 列表
- 矩阵
- 数组
- 数据帧
- 图表
- barplot()
- boxplot()
- hist()
- pie()
- 实用函数
- apply()
- head()
- 排序
简单函数
#包的安装和使用
install.packages("package")  #注意括号内包名要加""
library(package")

help(func/pack)

#查询某个变量的类型
class(obj)

#清除变量
rm(object)
rm(list = ls())   #清除所有变量
数据类型
向量
#初始化
>t <- c("Sun","Mon","Tue","Wed","Thurs","Fri","Sat")
> seq(6,7,by=0.4)
[1] 6.0 6.4 6.8

#访问
>t[c(2,3,6)]
[1] "Mon" "Tue" "Fri"
>t[c(TRUE,FALSE,FALSE,FALSE,FALSE,TRUE,FALSE)]
[1] "Sun" "Fri"
>t[c(-2,-5)]
[1] "Sun" "Tue" "Wed" "Fri" "Sat"
长度相同的两个向量可以进行一一对应的四则运算。若长度不相同,则较短向量的元素被循环以完成操作。
列表
list可以在其中包含许多不同类型的元素,如向量,函数甚至其中的另一个列表,是特殊形式的向量。
#初始化
>list_data <- list(c("Jan","Feb","Mar"), matrix(c(3,9,5,1,-2,8), nrow = 2),
   list("green",12.3))

#命名元素
>names(list_data) <- c("1st Quarter", "A_Matrix", "A Inner list")

#访问
> print(list_data[3])
$`A Inner list`
$`A Inner list`[[1]]
[1] "green"

$`A Inner list`[[2]]
[1] 12.3

>print(list_data$A_Matrix)
     [,1] [,2] [,3]
[1,]    3    5   -2
[2,]    9    1    8

#在末尾添加或删除元素
>list_data[length(list_data)+1] <- "New element"
>list_data[4] <- NULL
矩阵
#初始化
matrix(data, nrow, ncol, byrow, dimnames)
#data是vector类型
#默认byrow=FALSE,即按列填充
#dimnames是分配给行和列的名称,一定是list类型
>rownames = c("row1", "row2", "row3", "row4")
>colnames = c("col1", "col2", "col3")
>P <- matrix(c(3:14), nrow = 4, byrow = TRUE, dimnames = list(rownames, colnames))
> print(P)
     col1 col2 col3
row1    3    4    5
row2    6    7    8
row3    9   10   11
row4   12   13   14

#访问
>print(P[1,3])
[1] 5
>print(P[2,])
col1 col2 col3
   6    7    8
>print(P[,1])
row1 row2 row3 row4
   3    6    9   12
维数相同的矩阵可以进行一一对应的四则运算。
数组
matrix(data, dim, dimnames)
#data是vector类型
#dim指定行1列2矩阵3等维度
#dimname是分配给行和列的名称,一定是list类型

#初始化
>vector1 <- c(5,9,3,4,7)
>vector2 <- c(8,10,11,12,13,14,15)
>result <- array(c(vector1,vector2),dim = c(2,3,2))
>print(result)
, , 1

     [,1] [,2] [,3]
[1,]    5    3    7
[2,]    9    4    8

, , 2

     [,1] [,2] [,3]
[1,]   10   12   14
[2,]   11   13   15

#访问
>print(result[2,,2])
[1] 11 13 15
>print(result[1,3,1])
[1] 7
数据帧
数据帧是表或二维阵列状结构,其中每一列包含一个变量的值,以下是数据帧的特性。
- 列名称应为非空。 行名称应该是唯一的。
- 存储在数据帧中的数据可以是数字,因子或字符类型。
- 每个列应包含相同数量的数据项。
# 初始化
>BMI <- data.frame(
   gender = c("Male", "Male","Female"),
   height = c(152, 171.5, 165),
   weight = c(81,93, 78),
   Age = c(42,38,26)
)
>print(BMI)
  gender height weight Age
1   Male  152.0     81  42
2   Male  171.5     93  38
3 Female  165.0     78  26

#查看结构
>str(BMI)
'data.frame':	3 obs. of  4 variables:
 $ gender: Factor w/ 2 levels "Female","Male": 2 2 1
 $ height: num  152 172 165
 $ weight: num  81 93 78
 $ Age   : num  42 38 26

#获取数据的统计摘要和性质
> print(summary(BMI))
    gender      height          weight          Age
 Female:1   Min.   :152.0   Min.   :78.0   Min.   :26.00
 Male  :2   1st Qu.:158.5   1st Qu.:79.5   1st Qu.:32.00
            Median :165.0   Median :81.0   Median :38.00
            Mean   :162.8   Mean   :84.0   Mean   :35.33
            3rd Qu.:168.2   3rd Qu.:87.0   3rd Qu.:40.00
            Max.   :171.5   Max.   :93.0   Max.   :42.00
访问提取数据
#特定列
> result <- data.frame(BMI$gender,BMI$height)
> print(result)
  BMI.gender BMI.height
1       Male      152.0
2       Male      171.5
3     Female      165.0

#特定行
> print(BMI[1:2,])
  gender height weight Age
1   Male  152.0     81  42
2   Male  171.5     93  38

#特定行列
> print(BMI[c(1,3),c(1,2)])
  gender height
1   Male    152
3 Female    165
#添加列
>BMI$TS<-c(...)
#添加行
>rbind(BMI,BMI.new)图表
#保存图表
png(file = "")
plot
dev.off()
barplot()
barplot(H, xlab, ylab, main, names.arg, col)- H是包含在条形图中使用的数值的向量或矩阵。
- xlab是x轴的标签。 ylab是y轴的标签。
- main是条形图的标题。
- names.arg是在每个条下出现的名称的向量。
- col用于向图中的条形提供颜色。
H <- c(7,12,28,3,41)
M <- c("Mar","Apr","May","Jun","Jul")
barplot(H,names.arg = M,xlab = "Month",ylab = "Revenue",col = "blue",
main = "Revenue chart",border = "red")
boxplot()
boxplot(x, data, notch, varwidth, names, main)- x是向量或公式。
- 数据是数据帧。
- notch是逻辑值。 设置为TRUE以绘制凹口。
- varwidth是一个逻辑值。 设置为true以绘制与样本大小成比例的框的宽度。
- names是将打印在每个箱线图下的组标签。
常用
boxplot(X)
boxplot(Y~X,data=dat,col="lightblue")
hist()
直方图表示被存储到范围中的变量的值的频率。 直方图类似于条形图,但不同之处在于将值分组为连续范围。 直方图中的每个柱表示该范围中存在的值的数量的高度。
hist(v,main,xlab,xlim,ylim,breaks,col,border)- v是包含直方图中使用的数值的向量。
- border用于设置每个条的边框颜色。
- xlim用于指定x轴上的值的范围。 ylim用于指定y轴上的值的范围。
- break用于控制x轴分段。
常用
#break向量标注断点
breaks=c(0,5,10,15)  #(0,5),(5,10)...
breaks=seq(0,100,5)   #(0,5),...(95,100)
pie()
pie(x, labels, radius, main, col, clockwise)- x是包含饼图中使用的数值的向量。
- labels用于给出切片的描述。
- radius表示饼图圆的半径(值-1和+1之间)。
- main表示图表的标题。
- col表示调色板。
- clockwise是指示片段是顺时针还是逆时针绘制的逻辑值。
常用
library(plyr)
x<-count(dat$Region)  #统计Region每个变量频数
rname_temp<-as.vector(as.matrix(x[1]))   #保存每个变量名
H<-as.vector(as.matrix(x[2]))    #保存每个变量频数
rname<-paste(rname_temp,"(",H,")",sep="")    #pie每个标注为 名(频数)
pie(H,labels=rname)
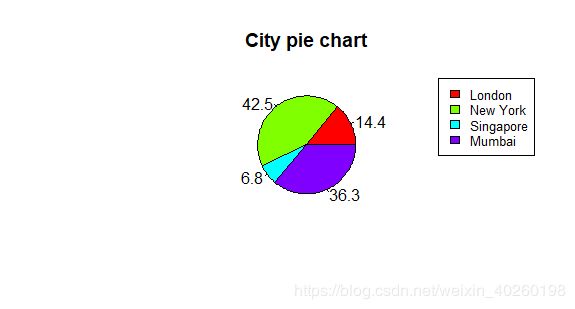
x <- c(21, 62, 10,53)
labels <- c("London","New York","Singapore","Mumbai")
piepercent<- round(100*x/sum(x), 1)
# Plot the chart.
pie(x, labels = piepercent, main = "City pie chart",col = rainbow(length(x)))
legend("topright", c("London","New York","Singapore","Mumbai"), cex = 0.8,
fill = rainbow(length(x)))实用函数
apply()
apply(array, margin, FUN, ...)
#在array上,沿margin方向,依次调用FUN。返回值为vector。1对应为1表示行,2表示列。
head()
head(x, ...)
#n>=0时,显示前n行,n<0时,显示除最后n行外所有数据
排序
x<-c(1,5,8,2,9,7,4)

#order
order(x, decreasing = FALSE, na.last = NA, ...)
#返回值是对应“排名”的元素所在向量中的位置
#na.last: if TRUE, NAs are put at last position, FALSE at first, if NA, remove them (default)

>order(x)
[1] 1 4 7 2 6 3 5

#sort
sort(x, decreasing = FALSE,...)
#返回值排序后的数值向

>sort(x)
[1] 1 2 4 5 7 8 9

#rank
rank(x, decreasing = FALSE,...)
#返回值对应元素的“排名”

>rank(x)
[1] 1 4 6 2 7 5 3 