预测分析 Python ARIMA模型预测(学习笔记)
import numpy as np
import pandas as pd
import matplotlib.pyplot as plt
import statsmodels.api as sm

#读取数据
data=pd.read_excel("data_test.xls",index_col=0)
data=data['number']
data.plot(figsize=(12,8)) #原图
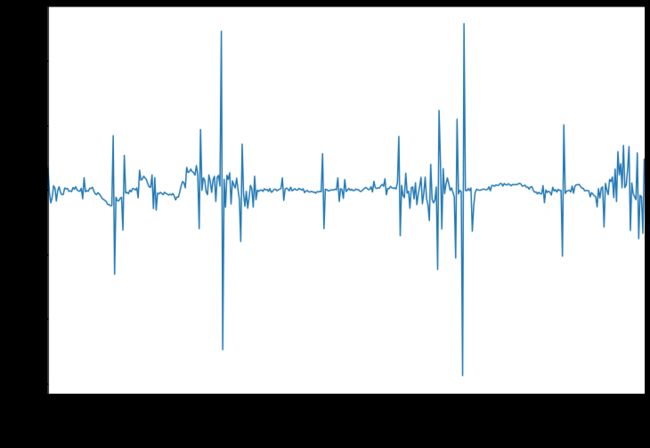
#数据带有周期性,先一阶差分,再144步差分
diff_1=data.diff(1)
diff1=diff_1.dropna()
diff1_144_1=diff_1-diff_1.shift(144)
diff1_144=diff1_144_1.dropna()
#画图判断是否平稳
fig=plt.figure(figsize=(12,8))
ax=fig.add_subplot(111)
diff1_144.plot(ax=ax)
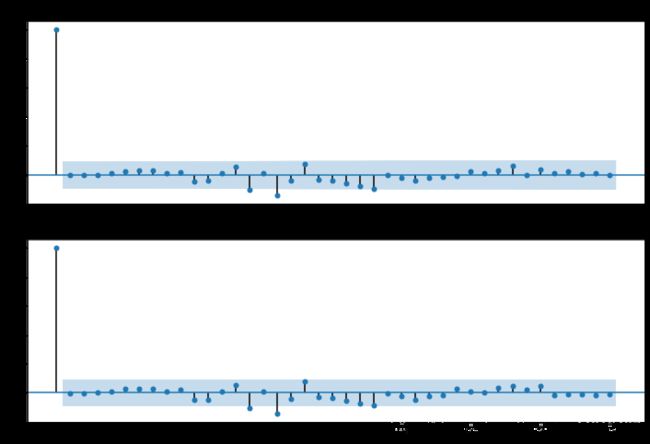
#求差分序列的自相关图ACF和偏自相关图PACF
fig=plt.figure(figsize=(12,8))
ax1=fig.add_subplot(211)
fig=sm.graphics.tsa.plot_acf(diff1_144,lags=40,ax=ax1)
ax2=fig.add_subplot(212)
fig=sm.graphics.tsa.plot_pacf(diff1_144,lags=40,ax=ax2)
plt.show()
#模型定阶,根据aic、bic、hqic,三者都是越小越好
arma_mod01=sm.tsa.ARMA(diff1_144,(0,1)).fit()
print(arma_mod01.aic,arma_mod01.bic,arma_mod01.hqic)
arma_mod10=sm.tsa.ARMA(diff1_144,(1,0)).fit()
print(arma_mod10.aic,arma_mod10.bic,arma_mod10.hqic)
arma_mod60=sm.tsa.ARMA(diff1_144,(6,0)).fit()
print(arma_mod60.aic,arma_mod60.bic,arma_mod60.hqic)
arma_mod61=sm.tsa.ARMA(diff1_144,(6,1)).fit()
print(arma_mod61.aic,arma_mod61.bic,arma_mod61.hqic)
8782.801951424293 8795.000275694605 8787.618254792987
8781.294547949288 8793.4928722196 8786.110851317982
8761.522020813209 8794.05088553404 8774.365496463062
8758.668160226449 8795.263133037382 8773.117070332533
#模型定为ARMA(6,1)
#计算残差
resid=arma_mod61.resid

#模型检验
#残差的acf和pacf
fig=plt.figure(figsize=(12,8))
ax1=fig.add_subplot(211)
fig=sm.graphics.tsa.plot_acf(resid.values.squeeze(),lags=40,ax=ax1) #squeeze()数组变为1维
ax2=fig.add_subplot(212)
fig=sm.graphics.tsa.plot_pacf(resid,lags=40,ax=ax2)
plt.show()
#残差自相关图断尾,所以残差序列为白噪声
#DW检验
print(sm.stats.durbin_watson(resid.values))
#DW值越接近2,越不相关
2.0010218978025396
#LB检验
r,q,p=sm.tsa.acf(resid.values.squeeze(),qstat=True)
d=np.c_[range(1,41),r[1:],q,p]
table=pd.DataFrame(d,columns=['lag','AC','Q','Prob(>Q)'])
print(table.set_index('lag'))
#最后一列,前12行>0.05,是白噪声序列
AC Q Prob(>Q)
lag
1.0 -0.002063 0.001847 0.965721
2.0 -0.002382 0.004315 0.997845
3.0 0.002808 0.007754 0.999819
4.0 0.009748 0.049281 0.999701
5.0 0.027424 0.378763 0.995894
6.0 0.029323 0.756320 0.993194
7.0 0.029986 1.152071 0.991989
8.0 0.009447 1.191448 0.996726
9.0 0.019532 1.360156 0.998057
10.0 -0.044771 2.248708 0.994054
11.0 -0.040862 2.990631 0.990849
12.0 0.011343 3.047942 0.995196
13.0 0.056182 4.457190 0.985285
14.0 -0.101289 9.048648 0.827922
15.0 0.009780 9.091558 0.872682
16.0 -0.136810 17.508472 0.353454
17.0 -0.040942 18.264090 0.372366
18.0 0.076638 20.918116 0.283564
19.0 -0.032965 21.410357 0.314576
20.0 -0.036031 21.999844 0.340519
21.0 -0.054508 23.352218 0.325490
22.0 -0.073111 25.791168 0.260756
23.0 -0.095535 29.965952 0.150382
24.0 -0.000842 29.966278 0.185872
25.0 -0.017792 30.111787 0.220131
26.0 -0.036573 30.728141 0.238550
27.0 -0.020433 30.920997 0.274395
28.0 -0.015075 31.026234 0.315917
29.0 -0.007246 31.050606 0.363043
30.0 0.028093 31.417890 0.395077
31.0 0.014406 31.514715 0.440505
32.0 0.034204 32.061910 0.463677
33.0 0.065449 34.070495 0.415925
34.0 0.002279 34.072937 0.464231
35.0 0.038986 34.789228 0.478234
36.0 0.011695 34.853844 0.522989
37.0 0.023147 35.107626 0.558008
38.0 0.009324 35.148905 0.602008
39.0 0.015081 35.257185 0.641311
40.0 -0.001944 35.258988 0.683390
#预测
predict_data=arma_mod61.predict('2017/4/4 23:50','2017/4/6 00:00',dynamic=False)
# 由于是用差分后的值做的预测,因此需要把结果还原
#144步差分还原
diff1_144_shift=diff_1.shift(144)
diff_recover_144=predict_data.add(diff1_144_shift)
#1阶差分还原
diff1_shift=data.shift(1)
diff_recover_1=diff_recover_144.add(diff1_shift)
diff_recover_1=diff_recover_1.dropna()
#输出预测值
print("预测值:")
print(diff_recover_1)
预测值:
2017-04-04 23:50:00 663684.828766
2017-04-05 00:00:00 645421.674270
dtype: float64
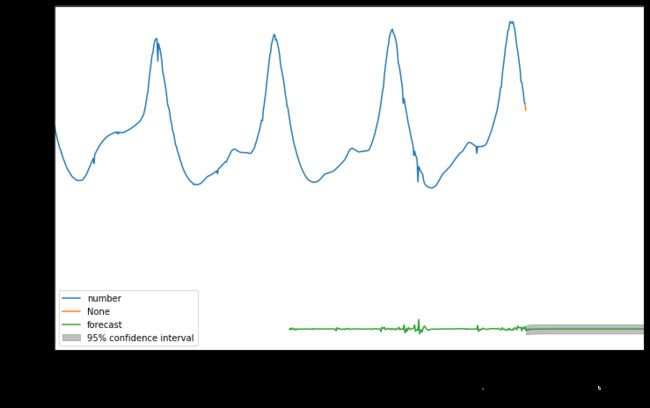
#实际值、预测值、差分预测值作图
fig,ax=plt.subplots(figsize=(12,8))
ax=data.ix['2017-04-01':].plot(ax=ax) #实际值
ax=diff_recover_1.plot(ax=ax) #预测值
fig=arma_mod61.plot_predict('2017/4/2 23:50','2017/4/6 00:00',dynamic=False,ax=ax,plot_insample=False)
plt.show()


