Pytorch3D_上手学习3D的AI模型
Pytorch3D_上手学习3D的AI模型
This article was original written by XRBLS, welcome re-post, first come with https://jinfagang.github.io . but please keep this copyright info, thanks, any question could be asked via wechat:
jintianiloveu
本文主要介绍pytorch3d的入门使用。最近Facebook开源了一个专门用于3D模型学习的库pytorch3d,说白了就是将3d中一些常用的操作封装起来了。那这个玩意到底有啥用呢?使用这个库又能完成什么事情呢?个人觉得这个库还是蛮有用的,它将一些常用的3D概念整理在一起,并且通过使用这个库可以完成一些基于3D的创作,对于学习入门3D的视觉生成、渲染、甚至是3d的目标检测、3维的姿态评估都大有裨益。今天的教程不难,但是可以教给大家一些很实在的干货:
- 3D中点线面的概念和编程表达方式;
- 如何绘制点云(pointcloud);
- 如何可视化我们的模型拟合结果;
- 使用pytorch3d来从任意球面拟合我们给定的模型。
闲话不多说开始上手吧~
依赖安装
开始之前请先安装必要依赖,pytorch3d不支持pypi,请从conda或者github clonez安装:
sudo pip3 install alfred-py
sudo pip3 install open3d
开始读取一个obj文件
这里有一个包含了很多3d模型的网站:https://free3d.com/3d-model/-dolphin-v1–12175.html。打开看看里面有很多3D的模型:
这些obj的模型文件都可以通过pytorch3d来读取的。我们假设你已经下载好了上面的海豚3D文件,我们来read一下看看:
"""
using pytorch3d deform a source mesh to target mesh using 3D loss functions

"""
import os
from pytorch3d.io import load_obj, save_obj
from pytorch3d.structures import Meshes
from pytorch3d.utils import ico_sphere
from pytorch3d.ops import sample_points_from_meshes
from pytorch3d.loss import (
    chamfer_distance,
    mesh_edge_loss,
    mesh_normal_consistency,
    mesh_laplacian_smoothing
)
import numpy as np
import torch

import matplotlib.pyplot as plt
import matplotlib as mpl
from mpl_toolkits.mplot3d import Axes3D
from alfred.dl.torch.common import device
import open3d as o3d

trg_obj = os.path.join('./data', '10014_dolphin_v2_max2011_it2.obj')

verts, faces, aux = load_obj(trg_obj)
print('verts: ', verts)
print('faces: ', faces)
print('aux: ', aux)
这里就需要阐述一下,研究一个3D对象,我们需要关注哪些量呢?换句话说,那些值可以用来确定一个3d物体呢?
verts: 其实就是3d点,我们可以将一个3d物体离散化,那么本质上它就是由一系列的3d点构成的,最常见比如雷达的3d点云;faces: 但只有3d的坐标其实还不够,我们还需要一些链接这些点的面,这就是我们所说的faces。在pytorch3d里面,构成一个面最少的点事多少呢?应该是3,而faces的数据结构也恰好是由3个verts的idx构成的一个面;aux: 这个指标应该就是一些渲染用的东西,我们其实只要前两个指标即可。
## 尝试用open3d来绘制点云
open3d是一个非常好的库。个人认为应该是python下面最好用的3d可视化库吧。intel出品。
face_idx = faces.verts_idx.to(device)
verts = verts.to(device)

center = verts.mean(0)
verts = verts - center
scale = max(verts.abs().max(0)[0])
verts = verts / scale

trg_mesh = Meshes(verts=[verts], faces=[face_idx])
src_mesh = ico_sphere(4, device)

# we can print verts as well, using open3d
verts_points = verts.clone().detach().cpu().numpy()
print(verts_points)
pcobj = o3d.geometry.PointCloud()
pcobj.points = o3d.utility.Vector3dVector(verts_points)
o3d.visualization.draw_geometries([pcobj])
我们接着上面的代码继续,使用open3d就可以得到上图的结果:
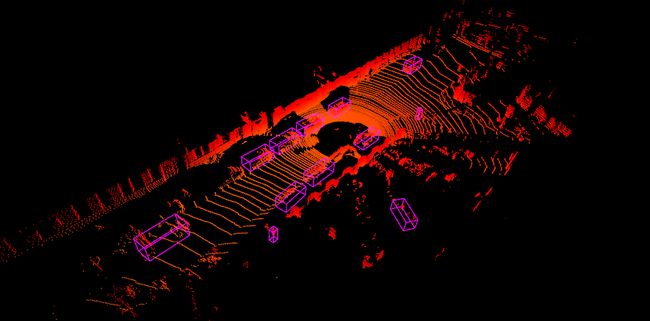
最后给大家安利一下alfred-py, 这个库也拥有一些3d的可视化操作,比如在3d点云上画3d的boundingbox:
github地址:https://github.com/jinfagang/alfred
使用pytorch3d拟合海豚
我们将使用pytorch3d来拟合海豚的可视化结果:
def plot_pointcloud(mesh, title=""):
    verts = mesh.verts_packed()
    faces = mesh.faces_packed()
    x, y, z = verts.clone().detach().cpu().unbind(1)
    fig = plt.figure(figsize=(5, 5))
    ax = Axes3D(fig)
    ax.scatter3D(x, z, -y)
    ax.set_xlabel('x')
    ax.set_ylabel('z')
    ax.set_zlabel('y')
    ax.set_title(title)
    plt.show()

# start optimization loop
deform_verts = torch.full(src_mesh.verts_packed().shape, 0, device=device, requires_grad=True)
optimizer = torch.optim.SGD([deform_verts], lr=1.0, momentum=0.9)


Niter = 2000
# Weight for the chamfer loss
w_chamfer = 1.0
# Weight for mesh edge loss
w_edge = 1.0
# Weight for mesh normal consistency
w_normal = 0.01
# Weight for mesh laplacian smoothing
w_laplacian = 0.1
# Plot period for the losses
plot_period = 250

chamfer_losses = []
laplacian_losses = []
edge_losses = []
normal_losses = []

for i in range(Niter):
    # Initialize optimizer
    optimizer.zero_grad()
    # Deform the mesh
    new_src_mesh = src_mesh.offset_verts(deform_verts)
    # We sample 5k points from the surface of each mesh
    sample_trg = sample_points_from_meshes(trg_mesh, 5000)
    sample_src = sample_points_from_meshes(new_src_mesh, 5000)
    # We compare the two sets of pointclouds by computing (a) the chamfer loss
    loss_chamfer, _ = chamfer_distance(sample_trg, sample_src)
    # and (b) the edge length of the predicted mesh
    loss_edge = mesh_edge_loss(new_src_mesh)
    # mesh normal consistency
    loss_normal = mesh_normal_consistency(new_src_mesh)
    # mesh laplacian smoothing
    loss_laplacian = mesh_laplacian_smoothing(new_src_mesh, method="uniform")
    # Weighted sum of the losses
    loss = loss_chamfer * w_chamfer + loss_edge * w_edge + loss_normal * w_normal + loss_laplacian * w_laplacian
    # Print the losses
    print('i: {}, loss: {}'.format(i, loss))
    # Save the losses for plotting
    chamfer_losses.append(loss_chamfer)
    edge_losses.append(loss_edge)
    normal_losses.append(loss_normal)
    laplacian_losses.append(loss_laplacian)
    # Plot mesh
    if i % plot_period == 0:
        plot_pointcloud(new_src_mesh, title="iter: %d" % i)
    # Optimization step
    loss.backward()
    optimizer.step()
经过几千次迭代,我们就可以从一个任意的曲面,重构出海豚的3d空间结构。
总结
本文只是带大家入门pytorch3d库,更多关于3d目标检测,3d姿态估计的干货教程文章,欢迎大家订阅本专栏,你将在第一时间获取我们的教程。
欢迎大家加入神力人工智能学习社区:http://manaai.cn
