seaborn绘图包的使用
文章目录
- Seaborn概述
- seaborn提供的一些功能
- 内置数据集
- 准备工作
- 调用在线数据集
- seaborn主题风格与调色板设定
- 主题风格
- sns.set_context()
- 调色板
- seaborn.color_palette()
- seaborn.husl_palette()和seaborn.hls_palette()
- 3.seaborn.cubehelix_palette()
- light_palette() 和 dark_palette()
- 交互式调色组件
Seaborn概述
Seaborn是基于matplotlib的Python数据可视化库,并与pandas数据结构紧密集成。它提供了一个高级界面,用于绘制引人入胜且内容丰富的统计图形。它相对matplotlib用起来很简单,只需要简单几行代码就能绘制出比较好的图。
seaborn提供的一些功能
- 面向数据集的API,用于检查多个变量之间的关系
- 专门支持使用分类变量显示观察结果或汇总统计信息
- 可视化单变量或双变量分布以及在数据子集之间进行比较的选项
- 不同种类因变量的线性回归模型的自动估计和绘图
- 方便查看复杂数据集的整体结构
- 用于构造多图网格的高级抽象,可让您轻松构建复杂的可视化
- 带有几个内置主题的 matplotlib图形样式的精确控制
- 选择能够忠实显示数据中图案的调色板的工具
- 提供一些内置数据集
下面我会通过一些简单绘图,以及一些可视化的应用来介绍部分功能,由于Seaborn这个包相对还是比较多,我提到的只是一个片面,最好的学习资料永远是官方文档。
内置数据集
seaborn自带了一些数据,方便我们学习使用,这几个数据集也是很好的数据可视化案例分析对象,我们可以查看一下相应自带的那些数据集。但首先我们要做好准备工作,这个是不能忘的。
准备工作
首先查看一下我们电脑上安装的seaborn版本是什么样,因为不同版本号存在图形和功能差异,这个小编踩过坑,同样的代码在不同版本的运行结果不同,有可能还会报错,希望大家可以和我的版本一致,至于怎么查看自己安装的包对应的版本号和如何升级,这个我就不介绍了。
import seaborn as sns
sns.__version__
运行结果:
'0.9.0'
我们方便后面的进行,最好还做一下这些准备,注意我用的jupyter notebook环境编辑的,有些存在差异,自己修正就行了。
#准备工作
import matplotlib.pyplot as plt
%matplotlib inline
import numpy as np
import pandas as pd
plt.rcParams['font.sans-serif'] = ['SimHei']# 支持中文显示
plt.rcParams['axes.unicode_minus'] = False #用来正常正负符号
sns.set_style('darkgrid',{'font.sans-serif':['SimHei','Arial']})
import warnings #去除部分警告信息
warnings.filterwarnings('ignore')
调用在线数据集
seaborn提供了一些在线数据集,方便我们入门学习使用,我们首先可以看看有哪些数据集:
names = sns.get_dataset_names()#查看seaborn自带的数据集名称
names
运行结果:
['anscombe',
 'attention',
 'brain_networks',
 'car_crashes',
 'diamonds',
 'dots',
 'exercise',
 'flights',
 'fmri',
 'gammas',
 'iris',
 'mpg',
 'planets',
 'tips',
 'titanic']
我们可能好奇这些数据集分别是什么类型的数据集,具体是什么,这个我们可以去github上面看这个链接。
看到这里我们就想知道怎么调用这些数据了,主要利用seaborn.load_dataset()函数。我们可以看看这个函数的相关参数:
#Seaborn内置数据集
# seaborn.load_dataset(name,cache=True,data_home=None,**kws)
# Seaborn内置数据集可以通过load_dataset函数加载数据集,返回dataframe对象
# name 参数是数据集名字,https://github. com/mwaskom/seaborn-data定义数据集名。
# cache参数是否提供缓存。
# data_home参数是指定缓存路径,默认当前用户home下的seaborn-
# data 目录中。
# sns. get_dataset_names ()获得数据集名字
下面我以泰坦尼克号的数据为例,给大家看看怎么使用:
titanic=sns.load_dataset('titanic',cache=True)#导入泰坦尼克号数据集,以数据框的形式
当我们导入之后可以看看数据:
titanic.head(10)#显示前十条数据,默认五条
seaborn主题风格与调色板设定
在python可视化中,Matplotlib自动化程度非常高,但是,掌握如何设置系统以便获得一个吸引人的图是相当困难的事。为了控制matplotlib图表的外观,Seaborn模块自带许多定制的主题和高级的接口。在很多图表设计的时候都是用这两个模块的结合。
主题风格
Seaborn中有五种可供选择的主题:
1.darkgrid(灰色网格)
2.whitegrid(白色网格)
3.dark(黑色)
4.white(白色)
5.ticks(十字叉)
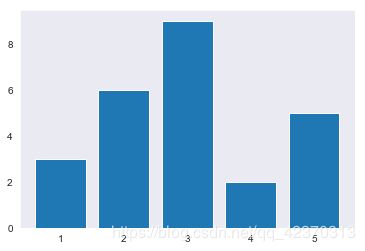
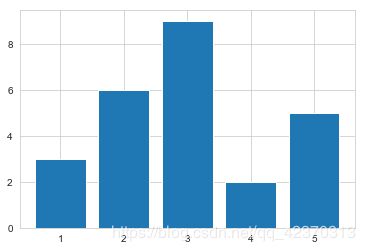
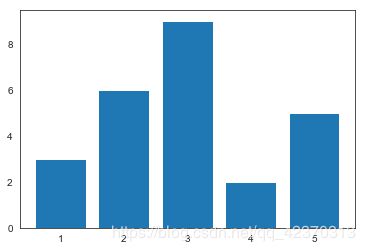
我们用简单的图示来展示一下,我们画一个简单的柱状图:
sns.set()#引入seaborn模块,转换成Seaborn模式画图,
sns.set_style('darkgrid')
plt.bar([1,2,3,4,5],[3,6,9,2,5])
运行结果如下:

seaborn默认浅灰色背景与白色网络线,也就是这样。
sns.set_style("dark")
plt.bar([1,2,3,4,5],[3,6,9,2,5])
sns.set_style("whitegrid")
plt.bar([1,2,3,4,5],[3,6,9,2,5])
sns.set_style("white")
plt.bar([1,2,3,4,5],[3,6,9,2,5])
sns.set_style("ticks")
plt.bar([1,2,3,4,5],[3,6,9,2,5])
运行结果:
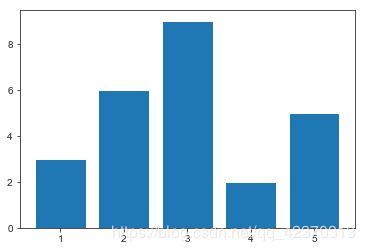
white和ticks这两个主题其实很相似,white和ticks两种主题都会包含没有必要的上边框和右边框。我们可以用despine()函数去除。
sns.set_style("ticks")
plt.bar([1,2,3,4,5],[3,6,9,2,5])
sns.despine()#默认去除上面和右边,可以修改
seaborn.despine(fig=None, ax=None, top=True, right=True, left=False, bottom=False, offset=None, trim=False)
图: matplotlib图,可选该图用于定义所有轴,默认使用当前图。
ax : matplotlib轴,可选特定轴反对去脊椎。
顶部,右侧,左侧,底部: 布尔值,可选如果为True,则删除该脊椎。
offset : int或dict,可选绝对距离(以磅为单位),单个值适用于所有;字典可用于设置每侧的偏移值。
trim: 布尔型,可选如果为True,刻度限制
示例
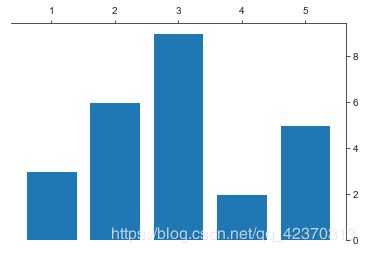
sns.set_style("ticks")
plt.bar([1,2,3,4,5],[3,6,9,2,5])
sns.despine(top=False, right=False, left=True, bottom=True)
这只是作为示例,这个图非常丑:
除了可以用set_style()来设置风格,还可以用axes_style()。有兴趣的去官方文档查看,这里我不做介绍。
sns.set_context()
seaborn.set_context(context = None,font_scale = 1,rc = None )
设置绘图上下文参数。
我们可以试试:
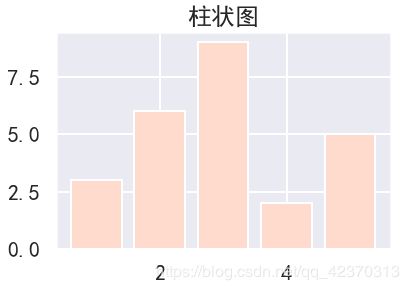
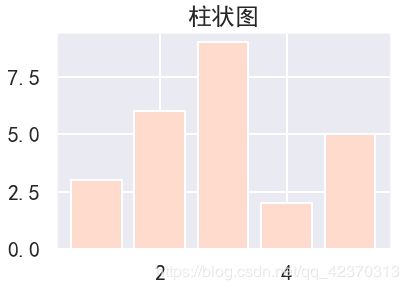
sns.set_context("poster")
plt.bar([1,2,3,4,5],[3,6,9,2,5])
plt.title('柱状图')
运行结果:
但我们也可以结合matplotlib两个包来绘图:
sns.set_style('darkgrid',{'font.sans-serif':['SimHei','Arial']})
plt.bar([1,2,3,4,5],[3,6,9,2,5])
plt.title('柱状图')
调色板
seaborn.color_palette()
颜色在可视化中非常重要,用来代表各种特征,并且提高整个图的观赏性。在seaborn中颜色主要分为连续渐变性和离散分类性。
先说说分类色板,主要用color_palette()函数。
· color_palette()能传入任何Matplotlib所支持的颜色
· color_palette()不写参数则默认颜色
· set_palette()设置所有图的颜色
6个默认的颜色循环主题: deep, muted, pastel, bright, dark, colorblind
首先我们可以查看一下color_palette方法返回默认的调色板信息:
#color_palette方法返回默认的调色板信息
current_palette = sns.color_palette()
print(current_palette)
输出结果如下:
[(0.12156862745098039, 0.4666666666666667, 0.7058823529411765), (1.0, 0.4980392156862745, 0.054901960784313725), (0.17254901960784313, 0.6274509803921569, 0.17254901960784313), (0.8392156862745098, 0.15294117647058825, 0.1568627450980392), (0.5803921568627451, 0.403921568627451, 0.7411764705882353), (0.5490196078431373, 0.33725490196078434, 0.29411764705882354), (0.8901960784313725, 0.4666666666666667, 0.7607843137254902), (0.4980392156862745, 0.4980392156862745, 0.4980392156862745), (0.7372549019607844, 0.7411764705882353, 0.13333333333333333), (0.09019607843137255, 0.7450980392156863, 0.8117647058823529)]
默认的颜色只有十种,我们可以查看一下:
current_palette = sns.color_palette()
sns.palplot(current_palette)
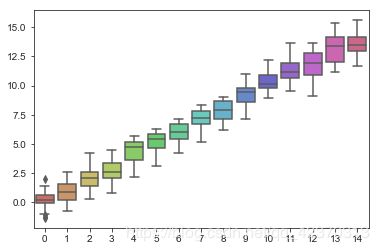
sns.palplot(sns.color_palette("hls", 15))
data = np.random.normal(size=(20, 15)) + np.arange(15)
sns.boxplot(data=data, palette=sns.color_palette("hls", 15))
运行结果为:
我们还可以通过hls_palette()函数来改变颜色的亮度和饱和度:
· l-亮度 lightness
· s-饱和度 saturation
我们可以看看这个:
sns.palplot(sns.hls_palette(15, l=0.3, s=0.8))
运行结果为:

连续渐变颜色:
色彩随数据变换,比如数据越来越重要则颜色越来越深。(只用在颜色加s即可)
#颜色渐变的调色板
sns.palplot(sns.color_palette("Reds"))
#颜色渐变的调色板
sns.palplot(sns.color_palette("Purples"))
#颜色渐变的调色板
sns.palplot(sns.color_palette("Oranges"))
运行结果为:

你们还可以用其他颜色加s多试试,种类很多。
如果想要翻转渐变,可以在面板名称中添加一个_r后缀。
sns.palplot(sns.color_palette("BuGn_r"))
sns.palplot(sns.color_palette("Accent_r"))
sns.palplot(sns.color_palette("pastel"))
sns.palplot(sns.color_palette("colorblind"))
sns.palplot(sns.color_palette("dark"))
sns.palplot(sns.color_palette("bright"))
sns.palplot(sns.color_palette("muted"))
sns.palplot(sns.color_palette("deep"))
sns.palplot(sns.color_palette("Accent",15))
seaborn.husl_palette()和seaborn.hls_palette()
我们可以在HUSL或HLS色系空间中获得一组均匀分布的颜色。
seaborn.husl_palette(n_colors = 6,h = 0.01,s = 0.9,l = 0.65 )
#h,s和l应该在0到1之间
n_colors:整数,调色板中的颜色数
h:浮点数,第一色调
s:浮点数 饱和度
l:浮点数 亮度
我们可以看看:
sns.palplot(sns.husl_palette(10, h=.5))
sns.palplot(sns.hls_palette(15,h=0.5, l=0.7, s=0.8))
sns.palplot(sns.husl_palette(10, s=.4))
运行结果为:

这个大家可以多试试其他参数,然后找到自己想要的颜色。这里husl和hls
是两种色相空间。注意区分,但参数的基本用法是一样的。
3.seaborn.cubehelix_palette()
seaborn.cubehelix_palette(n_colors=6, start=0, rot=0.4, gamma=1.0, hue=0.8, light=0.85, dark=0.15, reverse=False, as_cmap=False)
# 从cubehelix系统制作顺序调色板。
# 这将产生一个亮度线性降低(或增加)的色图。这意味着,如果将信息打印为黑白或由色盲人员查看,则将保留信息。“ cubehelix”也可以作为基于matplotlib的调色板使用,但是此功能使用户可以更好地控制调色板的外观,并具有一组不同的默认值。
#这将产生一个亮度线性降低(或增加)的色图。这意味着,如果将信息打印为黑白或由色盲人员查看,则将保留信息。“ cubehelix”也可以作为基于matplotlib的调色板使用,但是此功能使用户可以更好地控制调色板的外观,并具有一组不同的默认值。
# n_colors:int,调色板中的颜色数。
# start : float, 0 <= start <= 3,螺旋线开始处的色调。
# rot : float,在调色板范围内围绕饱和度轮旋转。
# gamma : float 0 <= gamma,强调深色(gamma <1)或较浅(gamma> 1)gamma。
# hue : float, 0 <= hue <= 1,颜色的饱和度
# dark : float 0 <= dark <= 1,调色板中最暗颜色的强度。
# light : float 0 <= light <= 1,调色板中最浅颜色的强度。
# reverse : bool,如果为True,则调色板将从黑暗变为明亮。
# as_cmap : bool,如果为True,则返回matplotlib颜色图,而不是颜色列表。
我们可以举几个例子看一下:
sns.palplot(sns.cubehelix_palette())
运行结果为:
sns.palplot(sns.cubehelix_palette(rot=-.4))
sns.palplot(sns.cubehelix_palette(start=2.8, rot=.3))
sns.palplot(sns.cubehelix_palette(reverse=True))
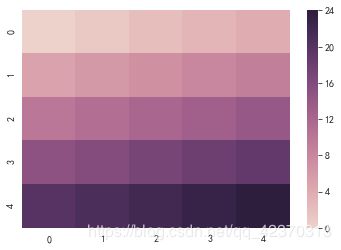
x = np.arange(25).reshape(5, 5)
cmap = sns.cubehelix_palette(as_cmap=True)
ax = sns.heatmap(x, cmap=cmap)
light_palette() 和 dark_palette()
# seaborn.light_palette(color,n_colors = 6,reverse = False,as_cmap = False,input ='rgb' )制作从浅色到深色的顺序调色板color。
# color:高值的基础色 十六进制代码,html颜色名称或input空间中的元组。
# input ='rgb',{'rgb','hls','husl',xkcd'},色彩空间可解释输入颜色。前三个选项适用于元组输入,后者适用于字符串输入。
# seaborn.dark_palette(color,n_colors = 6,reverse = False,as_cmap = False,input ='rgb' )制作从黑色到稍微深颜色的顺序调色板color。
# 其他参数和上面几个函数是用法相同的
我们可以动手试试:
sns.palplot(sns.light_palette("purple"))
sns.palplot(sns.light_palette("green", reverse=True))
sns.palplot(sns.light_palette((260, 75, 60), input="husl"))
sns.palplot(sns.dark_palette("purple"))
sns.palplot(sns.dark_palette("green",reverse=True))
sns.palplot(sns.dark_palette((260, 75, 60), input="husl"))
交互式调色组件
这里介绍一个可以直接交互的颜色组件:
# seaborn.choose_cubehelix_palette(as_cmap = False )
# 启动一个交互式窗口小部件,以创建一个顺序的cubehelix调色板。
# 这与cubehelix_palette()功能相对应。这种调色板适用于介于相对较低的较低值和较高的较高值之间的数据。cubehelix系统允许调色板在整个范围内具有更大的色相变化,这有助于区分更大范围的值。
# as_cmap:布尔,如果为True,则返回值为matplotlib颜色图,而不是离散颜色列表。
# pal或cmap:颜色列表或matplotlib颜色图,可以传递给绘图功能的对象。
我们可以看看:
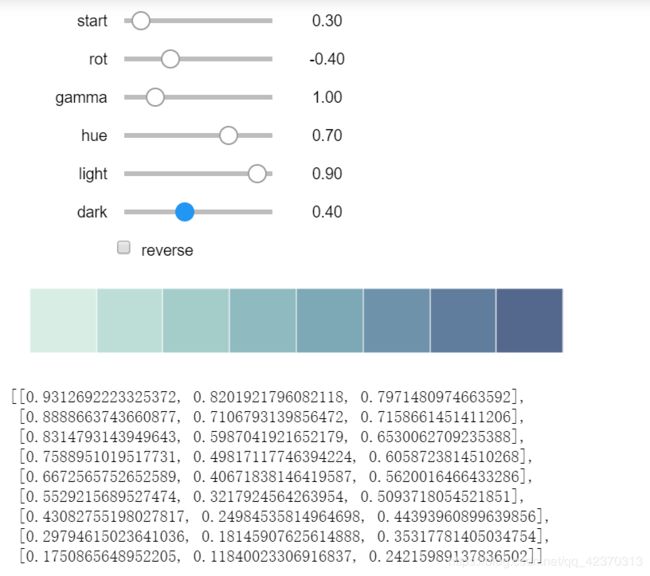
#一个交互式的方法
sns.choose_cubehelix_palette()

