Python数据分析示例(3)Day4
说明:本文章为Python数据处理学习日志,主要内容来自书本《利用Python进行数据分析》,Wes McKinney著,机械工业出版社。
1880-2010年间全美婴儿姓名
所需文件在Day2中下载,接下来要用到的一些文件的文件格式如下:
yob1880.txt-yob2010.txt
Mary,F,7065
Anna,F,2604
Emma,F,2003
整合数据
可以看到.txt文件中各个记录字段都以都好‘,’隔开,可以用pandas.read_csv将其加载到DataFrame中:
import pandas as pd
import os
path='E:\\Enthought\\book\\ch02\\names'
os.chdir(path)

names1880 = pd.read_csv('yob1880.txt',names=['name','sex','births'])
names1880[:5]
Out[8]:
        name sex  births
0       Mary   F    7065
1       Anna   F    2604
2       Emma   F    2003
3  Elizabeth   F    1939
4     Minnie   F    1746
这些文件中仅含有当年出现超过5次的名字。为简单起见,可以用births列的sex分组小计表示该年度的births总计:
names1880.groupby('sex').births.sum()
Out[11]:
sex
F     90993
M    110493
Name: births, dtype: int64
由于该数据集按年度被分隔成多个文件,所以第一件事情就死要将所有数据都组装到一个DataFrame里面,并加上一个year字段。使用pandas.connect即可达到这个目的:
years = range(1880,2011)
pieces = []
columns = ['names', 'sex','births']

for year in years:
    path = 'yob%d.txt' % year
    frame = pd.read_csv(path, names=columns)
    frame['year'] = year
    pieces.append(frame)

names = pd.concat(pieces, ignore_index=True)
#将所有数据整合到单个DataFrame数据里面
names[:5]
Out[25]:
       names sex  births  year
0       Mary   F    7065  1880
1       Anna   F    2604  1880
2       Emma   F    2003  1880
3  Elizabeth   F    1939  1880
4     Minnie   F    1746  1880
需要注意的有两点:
- concat默认是按行将多个DataFrame组合到一起。
- 必须指定ignore_index=True,因为我们不希望保留read_csv所返回的原始行号。
分析基本特征
现在我们得到一个非常大的DataFrame,它包含全部的名字数据。有了这些数据之后,我们就可以利用groupby或pivot_table在year和sex级别上对其进行聚合了:
total_births = names.pivot_table('births',index='year',columns='sex',aggfunc=sum)

total_births.tail() #查询最后5行数据
Out[36]:
sex         F        M
year
2006  1896468  2050234
2007  1916888  2069242
2008  1883645  2032310
2009  1827643  1973359
2010  1759010  1898382
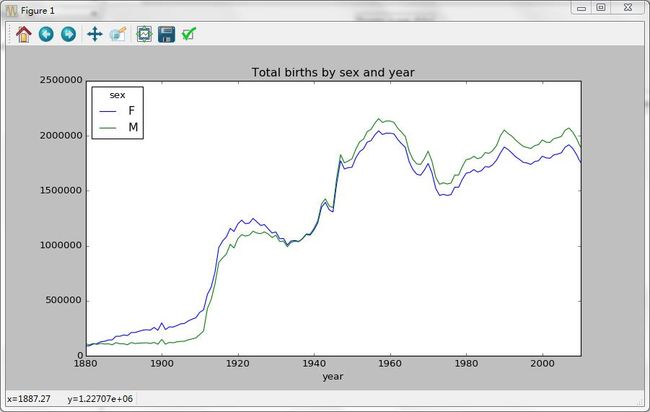
绘图:
total_births.plot(title='Total births by sex and year')
Out[37]: at 0x16485d68> 下面我们来插入一个prop列,用于存放指定名字的婴儿数相对于总出生数的比例。prop值为0.02表示每100个婴儿中有2个取了当前的名字。因此,我们先按year和sex分组,然后再将新列加到哥哥分组上:
def add_prop(group):
    births = group.births
    #births = group.births.astype(float)
    #如果不是python3则要进行类型转换,因为整数除法回向下圆整
    group['prop'] = births/births.sum()
    return group

names = names.groupby(['year','sex']).apply(add_prop)
names[:5]
Out[42]:
       names sex  births  year      prop
0       Mary   F    7065  1880  0.077643
1       Anna   F    2604  1880  0.028618
2       Emma   F    2003  1880  0.022013
3  Elizabeth   F    1939  1880  0.021309
4 Minnie F 1746 1880 0.019188在执行这样的分组处理时,一般都应该做一些有效性检查,比如验证所有分组的prop的总和是否为1。由于这是一个浮点数类型,所以我们用np.allclose来检查这个分总计值是否足够近似于(可能不会精确等于)1:
np.allclose(names.groupby(['year','sex']).prop.sum(),1)
Out[46]: True
为了便于实现进一步的分析,需要有去处该数据的一个子集:每对sex/year组合的前1000个名字。这又是一个分组操作:
 def get_top1000(group):
    return group.sort_values(by='births',ascending=False)[:1000]
#sort_index会出现warning,原因之前已说明

grouped = names.groupby(['year','sex'])
top1000 = grouped.apply(get_top1000)
top1000[:5]
Out[53]:
                names sex  births  year      prop
year sex
1880 F   0       Mary   F    7065  1880  0.077643
         1       Anna   F    2604  1880  0.028618
         2       Emma   F    2003  1880  0.022013
         3  Elizabeth   F    1939  1880  0.021309
         4     Minnie   F    1746  1880  0.019188
现在的结果数据集就小多了,接下来的数据分析工作就针对这个top1000数据集了。
分析命名趋势
有了完整的数据集和刚才生产的top1000数据集,我们就可以开始分析各种命名趋势了。首先我们将前1000个名字分为男女两个部分:
boys = top1000[top1000.sex=='M']
girls = top1000[top1000.sex=='F']
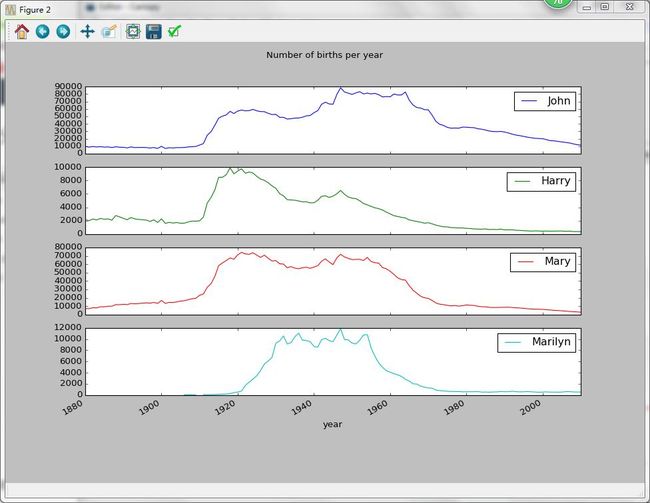
这是两个简单的时间序列,只需要稍作整理即可绘制出相应的图表(比如每年叫做John和Mary的婴儿数)。我们先生成一张按year和name统计的总出生数透视表:
total_births = top1000.pivot_table('births',index='year',columns='names',aggfunc=sum)
#因为之前定义column时属性设置成了names,后面也跟着用这个了= =

total_births[:5]
Out[65]:
names  Aaden  Aaliyah  Aarav  Aaron  Aarush  Ab  Abagail  Abb  Abbey  Abbie  \
year
1880     NaN      NaN    NaN  102.0     NaN NaN      NaN  NaN    NaN   71.0
1881     NaN      NaN    NaN   94.0     NaN NaN      NaN  NaN    NaN   81.0
1882     NaN      NaN    NaN   85.0     NaN NaN      NaN  NaN    NaN   80.0
1883     NaN      NaN    NaN  105.0     NaN NaN      NaN  NaN    NaN   79.0
1884     NaN      NaN    NaN   97.0     NaN NaN      NaN  NaN    NaN   98.0

names  ...    Zoa   Zoe  Zoey  Zoie  Zola  Zollie  Zona  Zora  Zula  Zuri
year   ...
1880   ...    8.0  23.0   NaN   NaN   7.0     NaN   8.0  28.0  27.0   NaN
1881   ...    NaN  22.0   NaN   NaN  10.0     NaN   9.0  21.0  27.0   NaN
1882   ...    8.0  25.0   NaN   NaN   9.0     NaN  17.0  32.0  21.0   NaN
1883   ...    NaN  23.0   NaN   NaN  10.0     NaN  11.0  35.0  25.0   NaN
1884   ...   13.0  31.0   NaN   NaN  14.0     6.0   8.0  58.0  27.0   NaN

subset = total_births[['John','Harry','Mary','Marilyn']]

subset.plot(subplots=True,figsize=(12,10),grid=False,title="Number of births per year")
Out[68]:
array([0x0000000033237CC0>,
       0x0000000016085D30>,
       0x000000002EAA6EF0>,
0x0000000029259048>], dtype=object) - 评估命名多样性增长
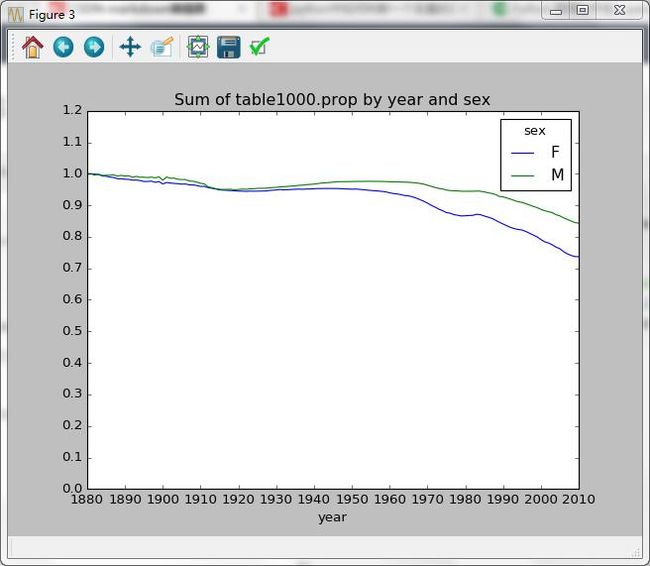
上图所反映的境地情况可能意味着父母原意个小孩起常见的名字越来越少。这个假设可以从数据中得到验证。一个办法是计算最流行的1000个名字所占的比例,按year和sex进行聚合并绘图:
table = top1000.pivot_table('prop',index='year',columns='sex',aggfunc=sum)

table.plot(title="Sum of table1000.prop by year and sex",yticks=np.linspace(0,1.2,13),xticks=range(1880,2020,10))
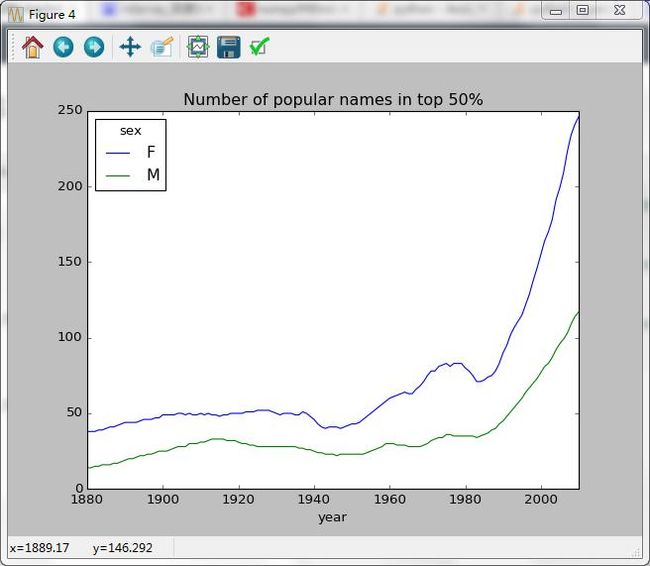
Out[71]: 0x2e0dbeb8> 上图结果表示,名字的多样性确实出现增长(前1000项的比例降低)。另一个办法是计算占总出生人口前50%的不同名字的数量,这个数字不太好计算。我们只考虑2010年男孩的名字:
df = boys[boys.year==2010]
df[:5]
Out[73]:
                    names sex  births  year      prop
year sex
2010 M   1676644    Jacob   M   21875  2010  0.011523
         1676645    Ethan   M   17866  2010  0.009411
         1676646  Michael   M   17133  2010  0.009025
         1676647   Jayden   M   17030  2010  0.008971
         1676648  William   M   16870  2010  0.008887
在按prop降序排列后,我们想知道前面多少个名字的人数加起来才够50%。虽然编写一个for循环也能达到目的,但NumPy有更聪明的矢量方法。先计算prop的累计和cumsum,然后通过searchsorted方法找到0.5应该被插在哪个位置才能保证不破坏顺序:
prop_cumsum = df.sort_values(by='prop',ascending=False).prop.cumsum()

prop_cumsum[:5]
Out[76]:
year  sex
2010  M    1676644    0.011523
           1676645    0.020934
           1676646    0.029959
           1676647    0.038930
           1676648    0.047817
Name: prop, dtype: float64

prop_cumsum.searchsorted(0.5)
Out[77]: array([116], dtype=int64) #注意这里的返回格式
由于数组索引从0开始,因此我们要给这个结果+1,即最终的结果为117。现在就对所有year/sex分组执行这个计算了。按这两个字段进行groupby处理,然后用一个函数计算个分组的这个值:
def get_quantile_count(group,q=0.5):
    group = group.sort_values(by='prop',ascending=False)
    return group.prop.cumsum().searchsorted(0.5)[0]+1
#注意!!!这里和书本不一样,上面看到python3的searchsorted()返回的是ndarray类型
#需要先取[0]元素,才能获得想要的数据,如果不作该处理,绘图会报错

diversity = top1000.groupby(['year','sex']).apply(get_quantile_count)
diversity = diversity.unstack('sex')
#依靠sex入栈操作,变Series为DataFrame

diversity.plot(title="Number of popular names in top 50%")
Out[129]: 0x218d7cf8>
上面碰到的问题,现在来仔细查看返回的各种类型:
prop_cumsum.searchsorted(0.5)
Out[132]: array([116], dtype=int64)

prop_cumsum.searchsorted(0.5)[0]
Out[133]: 116

type(prop_cumsum.searchsorted(0.5))
Out[134]: numpy.ndarray

type(prop_cumsum.searchsorted(0.5)[0])
Out[135]: numpy.int64
不作上述处理,则会出现下述错误:
diversity.plot(title="Number of popular names in top 50%",xticks=range(1880,2020,10))
---------------------------------------------------------------------------
TypeError                                 Traceback (most recent call last)
 in ()
----> 1 diversity.plot(title="Number of popular names in top 50%",xticks=range(1880,2020,10))

E:\Enthought\hzk\User\lib\site-packages\pandas\tools\plotting.pyc in __call__(self, kind, ax, figsize, use_index, title, grid, legend, style, logx, logy, loglog, xticks, yticks, xlim, ylim, rot, fontsize, colormap, table, yerr, xerr, label, secondary_y, **kwds)
   3561                            colormap=colormap, table=table, yerr=yerr,
   3562                            xerr=xerr, label=label, secondary_y=secondary_y,
-> 3563                            **kwds)
   3564     __call__.__doc__ = plot_series.__doc__
   3565

E:\Enthought\hzk\User\lib\site-packages\pandas\tools\plotting.pyc in plot_series(data, kind, ax, figsize, use_index, title, grid, legend, style, logx, logy, loglog, xticks, yticks, xlim, ylim, rot, fontsize, colormap, table, yerr, xerr, label, secondary_y, **kwds)
   2640                  yerr=yerr, xerr=xerr,
   2641                  label=label, secondary_y=secondary_y,
-> 2642                  **kwds)
   2643
   2644

E:\Enthought\hzk\User\lib\site-packages\pandas\tools\plotting.pyc in _plot(data, x, y, subplots, ax, kind, **kwds)
   2436         plot_obj = klass(data, subplots=subplots, ax=ax, kind=kind, **kwds)
   2437
-> 2438     plot_obj.generate()
   2439     plot_obj.draw()
   2440     return plot_obj.result

E:\Enthought\hzk\User\lib\site-packages\pandas\tools\plotting.pyc in generate(self)
   1021     def generate(self):
   1022         self._args_adjust()
-> 1023         self._compute_plot_data()
   1024         self._setup_subplots()
   1025         self._make_plot()

E:\Enthought\hzk\User\lib\site-packages\pandas\tools\plotting.pyc in _compute_plot_data(self)
   1130         if is_empty:
   1131             raise TypeError('Empty {0!r}: no numeric data to '
-> 1132                             'plot'.format(numeric_data.__class__.__name__))
   1133
   1134         self.data = numeric_data

TypeError: Empty 'DataFrame': no numeric data to plot
原因如下:
diversity.dtypes #这是没有取[0]的结果
Out[109]:
sex
F    object #"no numeric data to plot"因为不是数字类型
M    object #"no numeric data to plot"因为不是数字类型
dtype: object

diversity.dtypes #取[0]后均变为int64
Out[136]:
sex
F    int64
M    int64
dtype: object从上图中可以看出,女孩的名字的多样性总是比男孩的高,而且还在越来越高。
- “最后一个字母”的变革
2007年,一名婴儿姓名研究人员Laura Wattenberg在她自己的网站上指出(http://www.babynamewicard.com):近百年来,男孩名字在最后一个字母的分布发生了显著的变化。为了了解具体情况,首先将全部出生数据在年度、性别以及末位字母上进行聚合:
get_last_letter = lambda x:x[-1]
last_letters = names.names.map(get_last_letter)
last_letters.names = 'last_letter'

table = names.pivot_table('births',index=last_letters,columns=['sex','year'],aggfunc=sum)

subtable = table.reindex(columns=[1910,1960,2010],level='year')

subtable.head()
Out[143]:
sex           F                            M
year       1910      1960      2010     1910      1960      2010
names
a      108376.0  691247.0  670605.0    977.0    5204.0   28438.0
b           NaN     694.0     450.0    411.0    3912.0   38859.0
c           5.0      49.0     946.0    482.0   15476.0   23125.0
d        6750.0    3729.0    2607.0  22111.0  262112.0   44398.0
e      133569.0  435013.0  313833.0  28655.0  178823.0  129012.0
接下来,我们需要按总出生数对该表进行规范化处理,以便计算出各性别各末位字母占总出生人数的比例:
subtable.sum()
Out[144]:
sex  year
F    1910     396416.0
     1960    2022062.0
     2010    1759010.0
M    1910     194198.0
     1960    2132588.0
     2010    1898382.0
dtype: float64

letter_prop = subtable/subtable.sum() #转换类型.astype(float)
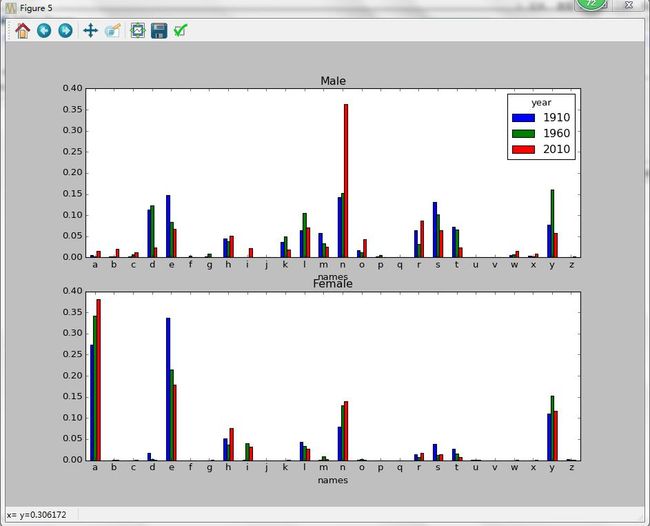
有了这个字母比例数据后,就可以生成一张各年度各性别的条形图了:
import matplotlib.pyplot as plt

fig,axes = plt.subplots(2,1,figsize=(10,8))

letter_prop['M'].plot(kind='bar',rot=0,ax=axes[0],title='Male')
Out[149]: 0x2b7ced30>

letter_prop['F'].plot(kind='bar',rot=0,ax=axes[1],title='Female',legend=False)
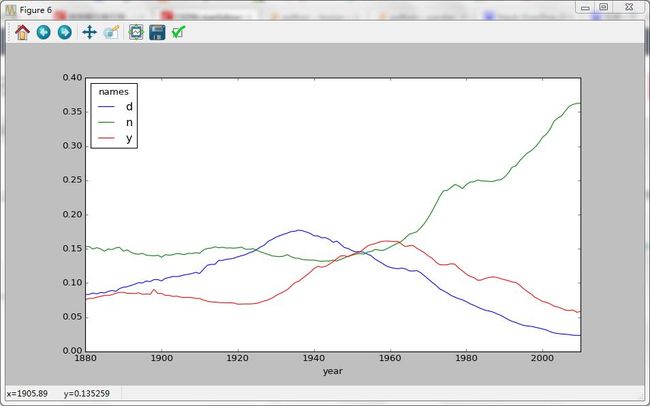
Out[150]: 0x213fd860> 从上图可以看出,从20世纪60年代开始,以字母“n”结尾的男孩子名字出现显著的增长。回到之前创建的那个完整表,按年度和性别对其进行规范化处理,并在男孩子名字中选出几个字母,最后进行转置以便将各个列做成一个时间序列:
letter_prop = table / table.sum()

dny_ts = letter_prop.ix[['d','n','y'],'M'].T

dny_ts.head()
Out[154]:
names         d         n         y
year
1880   0.083055  0.153213  0.075760
1881   0.083247  0.153214  0.077451
1882   0.085340  0.149560  0.077537
1883   0.084066  0.151646  0.079144
1884   0.086120  0.149915  0.080405
有了这个时间序列的DataFrame之后,就可以通过其plot方法绘制出一张趋势图了:
dny_ts.plot()
Out[155]: .axes._subplots.AxesSubplot at 0x2b7ce9b0> - 变成女孩名字的男孩名字(以及相反的情况)
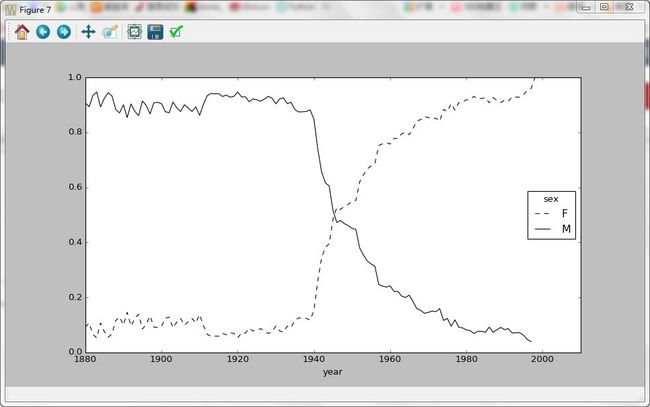
另一个有趣的趋势是,早年流行于男孩的名字近年来“变形了”,例如Lesley或Leslie。回到top1000数据集,找出其中以“lesl”开头的一组名字:
all_names = top1000.names.unique()

mask  =np.array(['lesl' in x.lower() for x in all_names])

lesley_like = all_names[mask]

lesley_like
Out[159]: array(['Leslie', 'Lesley', 'Leslee', 'Lesli', 'Lesly'], dtype=object)
然后利用这个结果过滤其他的名字,并按名字分组计算出生数已查看相对频率:
filtered = top1000[top1000.names.isin(lesley_like)]

filtered.groupby('names').births.sum()
Out[162]:
names
Leslee      1082
Lesley     35022
Lesli        929
Leslie    370429
Lesly      10067
Name: births, dtype: int64
接下来,我们按性别和年度进行聚合,并按年度进行规范化处理:
table = filtered.pivot_table('births',index='year',columns='sex',aggfunc=sum)

table = table.div(table.sum(1),axis=0)

table.tail()
Out[172]:
sex     F   M
year
2006  1.0 NaN
2007  1.0 NaN
2008  1.0 NaN
2009  1.0 NaN
2010  1.0 NaN

table.plot(style={'M':'k-','F':'k--'})
Out[173]: 0x2cd089e8> 