TfidfVectorizer
1、参数:
https://blog.csdn.net/feng_zhiyu/article/details/81952697
https://cloud.tencent.com/developer/article/1332181
2、
https://www.jianshu.com/p/e2a0aea3630c
https://www.wandouip.com/t5i134289/
https://www.cnblogs.com/Lin-Yi/p/8974108.html
https://www.jianshu.com/p/4bc7fbdafdeb
3、
tv=TfidfVectorizer()
X=tv.fit_transform(list)
weight=tv.fit(list).transform(list)
①X矩阵:
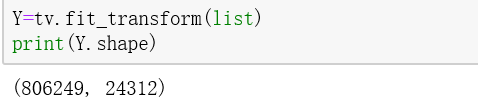
X.shape[0]是转换的文本总条数,X.shape[1]是转换文本的总词数。
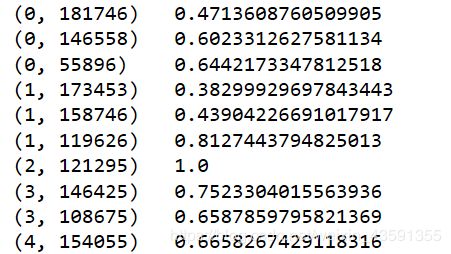
weight矩阵如图所例:
②nonzero():
例:a=mat([[1,0,0],[1,0,0],[0,0,1]])
→nonzero(a)返回值为两个矩阵:
(matrix([[0, 1, 2]], dtype=int32), matrix([[0, 0, 2]], dtype=int32))
分别对应:非零行,非零列。
则:(str(sorted(X[0].nonzero()[1])))返回:X矩阵第一条文本非零的列对应的词。
https://www.jianshu.com/p/e39746ba6d58
DF
1、选取某一列:df.columns['..']
删除某一列:df.drop['..',axis=1,inplace=True] //修改原数据。//删行就是0
中位数:df.median()
行数/列数:df.shape[0],df.shape[1]
为某行某列赋值:df.loc[行index,列名]=xxx或df[列名][行index]=xxx
2、df转list:df['..'].values.tolist()//画图用list
画图
https://www.jianshu.com/p/b1dee69767d3
https://www.cnblogs.com/nxld/p/7435930.html
https://www.jianshu.com/p/f868f137dbf3
plt.figure(figsize=(120,90),dpi=80) #面板/画布,大小
plt.title('blabla') #标题
plt.xlim(-2,2) #横轴范围
plt.ylim(-5,3)
plt.xlabel('xxx') #横轴变量名
plt.ylabel('yyy')
plt.xticks([数字],[名称]) #均list形式,名称可省
plt.yticks([数字],[名称])

ax=plt.subplot(111)
l1,=ax.plot(...)
l2,=ax.plot(...)
plt.legend(handles=[l1,l2,..],labels=['xx','xx',..],loc='lower right') #图例,句柄即曲线名称,显示位置:默认右上角,也可数字:1右上,2左上
plt.show() #显示图像
1、散点图
plt.scatter(x,y,c='red',alpha=1,marker='+', label='pickup')
https://cloud.tencent.com/developer/ask/134857/answer/239467
2、线图
plt.plot(x,y,color='red',linewidth=1.0,linestyle='--')//颜色,线宽,线样式
plt.subplot(332) //画布分份3*3,在第二块区域画图
plt.plot(xxx,yyy)
https://blog.csdn.net/weixin_41990278/article/details/93137009