机器学习案例实战:使用sklearn构造决策树模型
原创文章,如需转载请保留出处
本博客为唐宇迪老师python数据分析与机器学习实战课程学习笔记
一. 决策树复习
参考https://blog.csdn.net/qq_14815661/article/details/94838783
二. 决策树涉及参数
2.1 导入三大件
%matplotlib inline
import matplotlib.pyplot as plt
import pandas as pd


import warnings
warnings.filterwarnings("ignore")
2.2 导入california_housing数据
from sklearn.datasets.california_housing import fetch_california_housing
housing = fetch_california_housing()
print(housing)
{'data': array([[   8.3252    ,   41.        ,    6.98412698, ...,    2.55555556,
          37.88      , -122.23      ],
       [   8.3014    ,   21.        ,    6.23813708, ...,    2.10984183,
          37.86      , -122.22      ],
       [   7.2574    ,   52.        ,    8.28813559, ...,    2.80225989,
          37.85      , -122.24      ],
       ...,
       [   1.7       ,   17.        ,    5.20554273, ...,    2.3256351 ,
          39.43      , -121.22      ],
       [   1.8672    ,   18.        ,    5.32951289, ...,    2.12320917,
          39.43      , -121.32      ],
       [   2.3886    ,   16.        ,    5.25471698, ...,    2.61698113,
          39.37      , -121.24      ]]), 'target': array([4.526, 3.585, 3.521, ..., 0.923, 0.847, 0.894]), 'feature_names': ['MedInc', 'HouseAge', 'AveRooms', 'AveBedrms', 'Population', 'AveOccup', 'Latitude', 'Longitude'], 'DESCR': '.. _california_housing_dataset:\n\nCalifornia Housing dataset\n--------------------------\n\n**Data Set Characteristics:**\n\n    :Number of Instances: 20640\n\n    :Number of Attributes: 8 numeric, predictive attributes and the target\n\n    :Attribute Information:\n        - MedInc        median income in block\n        - HouseAge      median house age in block\n        - AveRooms      average number of rooms\n        - AveBedrms     average number of bedrooms\n        - Population    block population\n        - AveOccup      average house occupancy\n        - Latitude      house block latitude\n        - Longitude     house block longitude\n\n    :Missing Attribute Values: None\n\nThis dataset was obtained from the StatLib repository.\nhttp://lib.stat.cmu.edu/datasets/\n\nThe target variable is the median house value for California districts.\n\nThis dataset was derived from the 1990 U.S. census, using one row per census\nblock group. A block group is the smallest geographical unit for which the U.S.\nCensus Bureau publishes sample data (a block group typically has a population\nof 600 to 3,000 people).\n\nIt can be downloaded/loaded using the\n:func:`sklearn.datasets.fetch_california_housing` function.\n\n.. topic:: References\n\n    - Pace, R. Kelley and Ronald Barry, Sparse Spatial Autoregressions,\n      Statistics and Probability Letters, 33 (1997) 291-297\n'}
2.3 查看数据集
housing.data.shape
(20640, 8)
housing.data[0]
array([ 8.3252 , 41. , 6.98412698, 1.02380952,
322. , 2.55555556, 37.88 , -122.23 ])
#从sklearn里面导入tree模块
from sklearn里面导入tree模块 import tree
dtr = tree.DecisionTreeRegressor(max_depth = 2)
dtr.fit(housing.data[:, [6,7]], housing.target)
DecisionTreeRegressor(criterion=‘mse’, max_depth=2, max_features=None,
max_leaf_nodes=None, min_impurity_decrease=0.0,
min_impurity_split=None, min_samples_leaf=1,
min_samples_split=2, min_weight_fraction_leaf=0.0,
presort=False, random_state=None, splitter=‘best’)


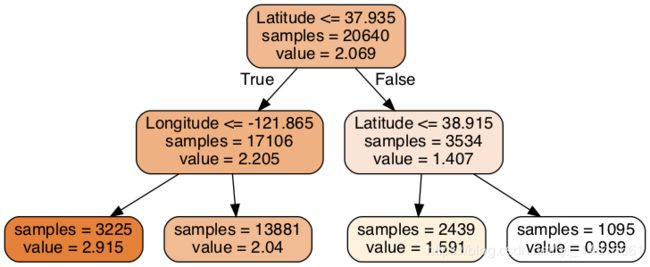
三. 数可视化与sklearn库简介
3.1 打印树
#要可视化显示,首先安装graphviz
dot_data = \
    tree.export_graphviz(
    dtr,
    out_file = None,
    feature_names = housing.feature_names[6:8],
    filled = True,
    impurity = False,
    rounded = True
    )
#pip install pydotplus
import pydotplus
graph = pydotplus.graph_from_dot_data(dot_data)
graph.get_nodes()[7].set_fillcolor("#FFF2DD")
from IPython.display import Image
Image(graph.create_png())
3.2 保存图片
#保存图片
graph.write_png("dtr_white_background.png")
3.3 参数构造
#train_test_split:切分数据
from sklearn.model_selection import train_test_split
#test_size = 0.1:取其中10%作为测试集
data_train, data_test, target_train, target_test = \
    train_test_split(housing.data, housing.target, test_size = 0.1, random_state = 42)
dtr = tree.DecisionTreeRegressor(random_state = 42)
dtr.fit(data_train, target_train)

dtr.score(data_test, target_test)
0.637355881715626
#构造随机森林
from sklearn.ensemble import RandomForestRegressor
rfr = RandomForestRegressor(random_state = 42)
rfr.fit(data_train, target_train)
rfr.score(data_test, target_test)
0.7910601348350835
四. sklearn参数选择
from sklearn.model_selection import learning_curve, GridSearchCV
tree_param_grid = {'min_samples_split': list((3,6,9)),'n_estimators':list((10,50,100))}
grid = GridSearchCV(RandomForestRegressor(),param_grid=tree_param_grid, cv=5)
grid.fit(data_train, target_train)
grid.cv_results_, grid.best_params_, grid.best_score_
({'mean_fit_time': array([0.74255824, 3.62014022, 8.01271801, 0.78548918, 3.97460575,
         7.70799823, 0.72534375, 3.59654679, 6.99079027]),
  'std_fit_time': array([0.0209494 , 0.0183893 , 0.45186198, 0.02845581, 0.01660582,
         0.27164939, 0.03465227, 0.0880729 , 0.04162768]),
  'mean_score_time': array([0.00837097, 0.03795204, 0.08044424, 0.00871553, 0.03907676,
         0.07545657, 0.00738921, 0.03274035, 0.06549611]),
  'std_score_time': array([0.00023387, 0.00145403, 0.00435639, 0.00078349, 0.00157401,
         0.0041592 , 0.00134716, 0.00216881, 0.00290008]),
  'param_min_samples_split': masked_array(data=[3, 3, 3, 6, 6, 6, 9, 9, 9],
               mask=[False, False, False, False, False, False, False, False,
                     False],
         fill_value='?',
              dtype=object),
  'param_n_estimators': masked_array(data=[10, 50, 100, 10, 50, 100, 10, 50, 100],
               mask=[False, False, False, False, False, False, False, False,
                     False],
         fill_value='?',
              dtype=object),
  'params': [{'min_samples_split': 3, 'n_estimators': 10},
   {'min_samples_split': 3, 'n_estimators': 50},
   {'min_samples_split': 3, 'n_estimators': 100},
   {'min_samples_split': 6, 'n_estimators': 10},
   {'min_samples_split': 6, 'n_estimators': 50},
   {'min_samples_split': 6, 'n_estimators': 100},
   {'min_samples_split': 9, 'n_estimators': 10},
   {'min_samples_split': 9, 'n_estimators': 50},
   {'min_samples_split': 9, 'n_estimators': 100}],
  'split0_test_score': array([0.78788456, 0.8072653 , 0.81070731, 0.79728973, 0.81093052,
         0.81070391, 0.79462194, 0.80524503, 0.81125436]),
  'split1_test_score': array([0.77996295, 0.79716321, 0.80183264, 0.78208436, 0.79857861,
         0.8021504 , 0.77865678, 0.8000627 , 0.79759165]),
  'split2_test_score': array([0.7794078 , 0.80125411, 0.80252996, 0.78448128, 0.80216889,
         0.80394068, 0.78755988, 0.80150532, 0.80040657]),
  'split3_test_score': array([0.79242883, 0.80991488, 0.81141231, 0.79327332, 0.8079729 ,
         0.81292937, 0.78818584, 0.80941489, 0.80965632]),
  'split4_test_score': array([0.78055862, 0.80612467, 0.80781837, 0.78519548, 0.80702989,
         0.80780828, 0.79129507, 0.80540379, 0.80479686]),
  'mean_test_score': array([0.78404876, 0.80434459, 0.80686033, 0.78846531, 0.80533646,
         0.8075067 , 0.78806425, 0.80432639, 0.8047415 ]),
  'std_test_score': array([0.00520286, 0.00455735, 0.00401166, 0.00580138, 0.00440039,
         0.00402798, 0.0053332 , 0.00328732, 0.00522478]),
  'rank_test_score': array([9, 5, 2, 7, 3, 1, 8, 6, 4], dtype=int32)},
 {'min_samples_split': 6, 'n_estimators': 100},
 0.8075067014301314)
4.1 交叉验证

rfr = RandomForestRegressor(min_samples_split = 3,n_estimators = 100, random_state = 42)
rfr.fit(data_train, target_train)
rfr.score(data_test, target_test)
0.8088623476993486
pd.Series(rfr.feature_importances_,index = housing.feature_names).sort_values(ascending = False)
MedInc 0.524257
AveOccup 0.137947
Latitude 0.090622
Longitude 0.089414
HouseAge 0.053970
AveRooms 0.044443
Population 0.030263
AveBedrms 0.029084
dtype: float64