基于轨迹数据的伴随关系分析挖掘
轨迹数据分析是时空数据挖掘的重点内容之一,也是相当有挑战任务之一。
伴随分析是轨迹数据的一种常见分析任务,但是伴随分析面临着三大挑战:摘自ICDM2013年论文Mining Following Relationships in Movement Data的表述:
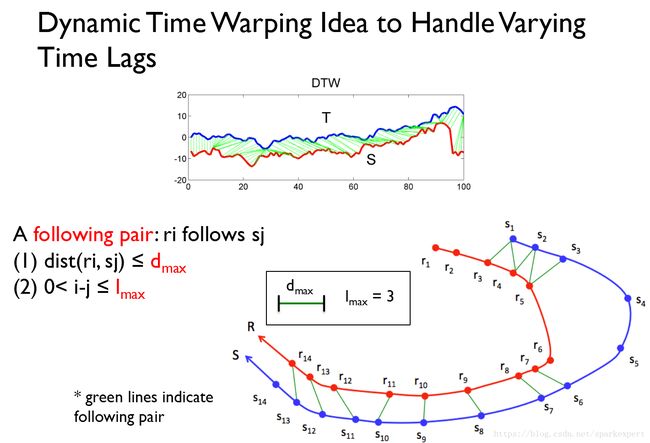
Challenge 1. The following time lag is usually unknown and varying. For example, if a coyote follows a wolf for food, sometimes it may arrive 1 minute late and sometimes the lag could be 10 minutes. In Figure 1,we show an illustrative example where r1 is 11 minutes behind s1, but then R catches up with S as r5 is only 3 minutes behind s3.•
挑战一:伴随的时间滞后性不固定且经常变化;
Challenge 2. The follower may not have exactly the same trajectory as the leader. As shown in Figure 1, follower R has a different trajectory from S. In reality, the follower may take a shortcut to catch up with the leader. Or, some followers may intentionally avoid taking the same route as the leader. For example, a suspect may take a different path to avoid being noticed by a victim.•
挑战二:伴随者的轨迹不一定与前者完全一致;
Challenge 3. The following relationship could be subtle and always happens in a short period of time. Various relationships, such as moving together, following, and being independent, could happen between two objects at different time periods. For example, a coyote only follows wolves closely when it is hungry. For the remaining time, its movement could be largely independent of the wolves’. In Figure 1, we can see that R follows S only before time 10:20 and moves together with S afterwards.Therefore, it is crucial to differentiate following relationships from other relationships and to find the correct time intervals in which following relationships actually occur.
挑战三:伴随关系可能发生在较短的时间范围内;
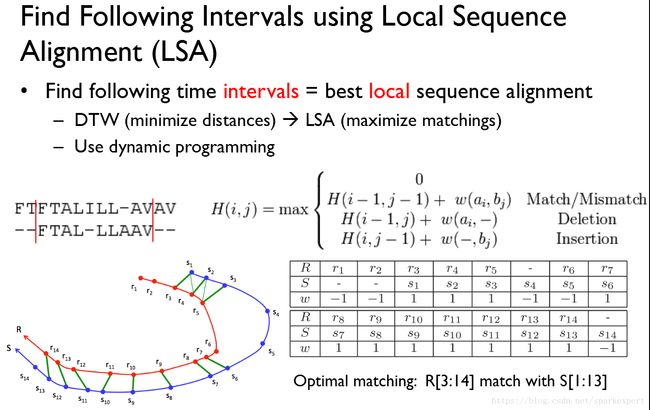
这三种挑战导致了实际应用中伴随关系挖掘的难度。在上面的论文中,提出一种LSA的伴随分析算法,其原理如下面两图所示:
当局部时空坐标点存在对齐的情况,即可判断为伴随。根据这一准则进行判断是否存在伴随关系。里面定义了两个简单的参数,一个是两个轨迹点之间的最大距离,一个是最大时间间隔。
function [interval,j_min_set] = find_following(seqA, seqB, d_max, l_max)
%% FIND_FOLLOWING Finds following intervals that seqB is following seqA
%   INTERVAL = FIND_FOLLOWING(SEQA,SEQB,D_MAX,L_MAX)
%   SEQA and SEQB are d X n trajectories, where d is the dimension
%   of corrdinates and n is the trajectory length.
%   D_MAX is the distance threshold.
%   L_MAX is the time threshold.
%   The result is in INTERVAL, where each row is one following interval.
%
%   [INTERVAL J_MIN_SET] = FIND_FOLLOWING(SEQA,SEQB,D_MAX,L_MAX) also
%   returns time lag set J_MIN_SET
%
%    Euclidean distance is used.

n = length(seqA);
match = zeros(1,n);
valid = zeros(1,n);
j_min_set = zeros(1,n);
dist_min_set = zeros(1,n);
for i=1:n
    dist_min = 1e6;
    j_min = -1;
    for j=max(1, i-l_max):min(n, i+l_max)
       dist = norm(seqB(:,i) - seqA(:,j),2); % Euclidean distance
       if (dist < dist_min)
            j_min = j;
            dist_min = dist;
       end;
    end;
    dist_min_set(i) = dist_min;
    if dist_min < d_max
        valid(i) = 1;
        if (j_min < i)
            dist_min2 = 1e6;
            k_min = -1;
            for k=max(1, j_min-l_max):min(n, j_min+l_max)
                dist2 = norm(seqB(:,k) - seqA(:,j_min),2); % Euclidean distance
                if dist2 < dist_min2
                    k_min = k;
                    dist_min2 = dist2;
                end
            end
            if k_min > j_min
                match(i) = 1;
            else
                match(i) = 0;
            end
        else
            match(i) = -1;
        end;
        j_min_set(i) = j_min - i;
    end;
end;
从上面这段核心代码可以看出,需要对轨迹数据集,根据距离和时间的关系进行判断。从而记录每一段中可能是否存在match。
执行完毕后,进行可视化,可以明显看到两个轨迹点从2484:3121之间存在伴随关系。


