无人驾驶传感器融合系列(十)—— 目标追踪之相机与激光雷达数据融合
无人驾驶传感器融合系列(十)—— 目标追踪之相机与激光雷达数据融合
本章摘要:前几章讲了单独相机实现目标追踪,这一章讲解如何实现相机和激光雷达数据融合。整体思路是这样的,1、先是坐标对齐,将雷达坐标转换到相机坐标。2、然后将激光点往像平面投影,得到投影到像平面的点云。3、借助图像检测的框图(前面提到的YOLOv3检测)对点云实现过滤聚类。4、对聚类点后处理。
0、概述
前视相机得到下面的图片:

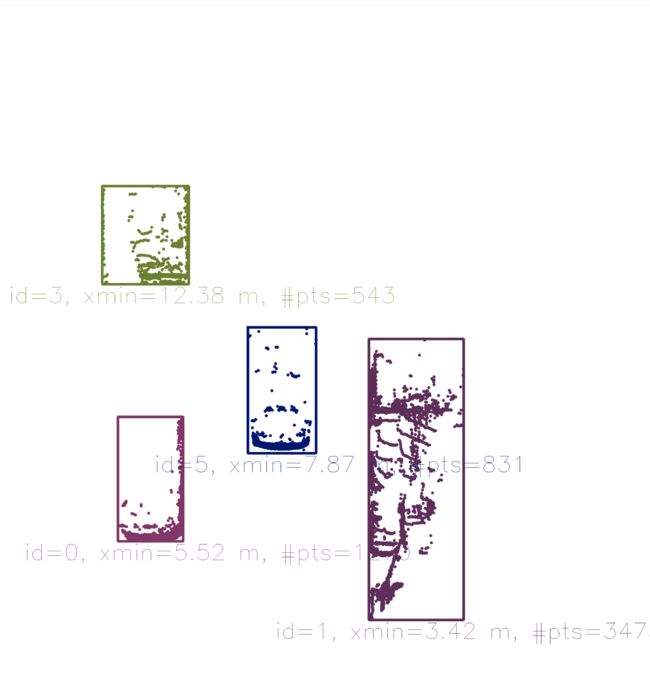
前视某一区域的雷达点云俯视图如下:
我们的目标就是综合相机图片,雷达点云数据,最终得到下面的多目标跟踪结果:

下面我们就来分析如何一步步达到这样的效果。
一、坐标对齐
相机坐标和激光雷达坐标位置不同,如果想把点云投影到图片上,需要对两坐标进行对其。将一个坐标和另一个坐标对齐,无非就是平移,旋转。
坐标平移:
下面通过二维坐标讲解下平移,将其转化到三维坐标道理是一样的。

上面可以看来,平移只是在相应的维度上加上平移量。但是为了将这种相加的形式改变为相乘的形式,这里使用了齐次坐标。齐次坐标只是在原来的维度上加一个维度,这样矩阵相加的形式就可以变成相乘的形式,这样所有的坐标变换(平移、缩放)都可以变成矩阵相乘的形式了。关于欧几里得空间、齐次坐标之间的转化如下:
坐标旋转:
二维坐标的旋转:

同样的道理,三维坐标的旋转可以看作,依次绕着三个轴旋转,联合的结果就可以得到最终的效果:

二、三维向二维平面投影
经过了坐标平移、旋转实现了激光雷达,相机的坐标对其。之后就可以将三维物体向像平面投影了,三维物体向二维平面投影变换如下:
下面是投影关系,从上面的几何关系,可以得到下面的变换公式。式子中k,l为单位变换缩放,从米缩放到像素。

此投影变换用矩阵的方式表达如下:

对上面的结果采用齐次坐标的形式,可以得到如下变换结果:

经过上面一些列的变换,平移、旋转、投影,最终将雷达点云投影到了像平面上了。整体表示如下:

对每个点云数据进行上面变换之后,就得到了像平面上的齐次坐标,然后将其转化回欧几里得坐标(公式上面提过),最终求得投影到像平面的结果。
三、KITTI数据集介绍
我们高速公路相机图片,点云数据来自KITTI数据集,下面大概介绍下要用的KITTI传感器配置、标定参数说明:
在文件 "calib_velo_to_cam.txt“ 中给了激光雷达到左边相机的平移、旋转参数:
calib_time: 15-Mar-2012 11:37:16

R: 7.533745e-03 -9.999714e-01 -6.166020e-04 1.480249e-02 7.280733e-04 -9.998902e-01 9.998621e-01 7.523790e-03 1.480755e-02

T: -4.069766e-03 -7.631618e-02 -2.717806e-01
在文件 “calib_cam_to_cam.txt” 中给了投影参数。
calib_time: 09-Jan-2012 13:57:47
…
R_rect_00: 9.999239e-01 9.837760e-03 -7.445048e-03 -9.869795e-03 9.999421e-01 -4.278459e-03 7.402527e-03 4.351614e-03 9.999631e-01

P_rect_00: 7.215377e+02 0.000000e+00 6.095593e+02 0.000000e+00 0.000000e+00 7.215377e+02 1.728540e+02 0.000000e+00 0.000000e+00 0.000000e+00 1.000000e+00 0.000000e+00
…
P_rect_00:就是上面的投影K值。
R_rect_00: is the 3x3 rectifying rotation to make image planes co-planar, i.e. to align both cameras of the stereo rig 。
四、投影前处理
点云开始向像平面投影之前需要对其进行处理,需要把下面这些点云过滤掉:
… positioned behind the Lidar sensor and thus have a negative x coordinate.
… too far away in x-direction and thus exceeding an upper distance limit.
… too far off to the sides in y-direction and thus not relevant for collision detection
… too close to the road surface in negative z-direction.
… showing a reflectivity close to zero, which might indicate low reliability.
for(auto it=lidarPoints.begin(); it!=lidarPoints.end(); ++it) {
        float maxX = 25.0, maxY = 6.0, minZ = -1.4;
        if(it->x > maxX || it->x < 0.0 || abs(it->y) > maxY || it->z < minZ || it->r<0.01 )
        {
            continue; // skip to next point
        }
最后得到的投影结果如下:
五、投影后处理
点云投影之后,需要对点云进行聚类,表明那些点云属于属于一个目标。联合 YOLO目标检测 讲过的框图,可以将投影到框图内的点云聚类成一类,得到下面的结果:
关于框图的所包含的数据如下:
struct BoundingBox { // bounding box around a classified object (contains both 2D and 3D data)

    int boxID; // unique identifier for this bounding box
    int trackID; // unique identifier for the track to which this bounding box belongs

    cv::Rect roi; // 2D region-of-interest in image coordinates
    int classID; // ID based on class file provided to YOLO framework
    double confidence; // classification trust

    std::vector<LidarPoint> lidarPoints; // Lidar 3D points which project into 2D image roi
    std::vector<cv::KeyPoint> keypoints; // keypoints enclosed by 2D roi
    std::vector<cv::DMatch> kptMatches; // keypoint matches enclosed by 2D roi
};
一些问题:
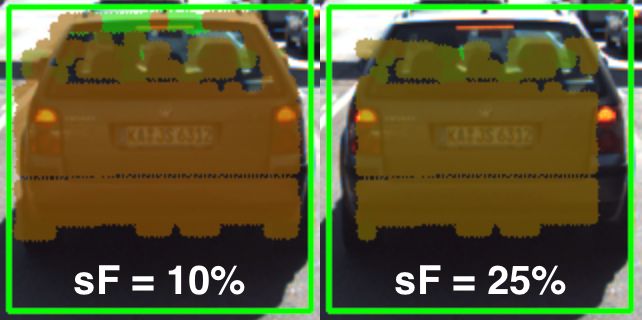
- 发现框图往往会比实际物体大一些,这样的话,会把一些不属于目标物体的点,聚类到该物体上了。所以往往会在原来框图的基础上缩小一定比例,然后将投影在缩小之后的小框图上的点保留,下面分别是缩小10%,25%的结果。

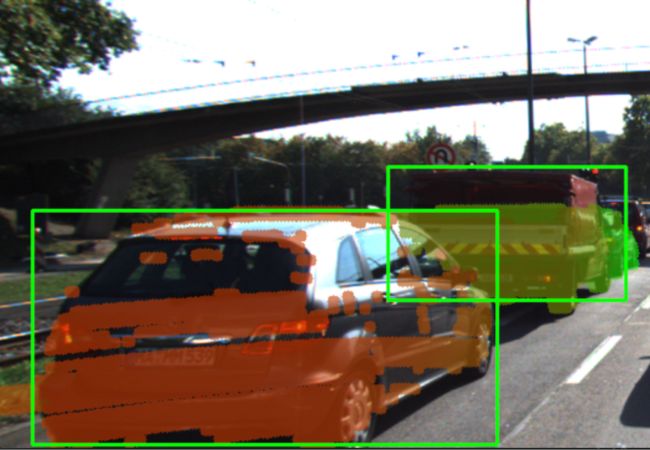
实际运用过程中往往会缩小5-10%,会达到比较好的聚类效果。 - 框图交叉时,有些点云会同时属于多个框图,造成聚类错误,比如下面的情景:

常规的做法是,将同时属于多个框图的点云去除掉,避免的它们的干扰。
算法运用
算法的应用,详见github,SFND_3D_Object_Tracking 。
文章说明:
Udacity 传感器融合课程笔记
