python3爬虫系列24之重庆微博地铁客运量爬取和可视化
python3爬虫系列24之重庆微博地铁客运量爬取和可视化
1.前言
在python3爬虫系列23之selenium+腾讯OCR识别验证码登录微博且抓取数据里面,我们既是又搞selenium自动化,又搞腾讯OCR识别,又搞图片验证码位置截取等等。
接下来,让你看看啥叫吐血。。。。
这里给大家透露小诀窍:
一般做爬虫爬取网站时,首选的都是m站,其次是wap站,最后考虑PC站,因为PC站的各种验证最多。
M站一般是指手机网页端的页面,也就是mobile移动端,移动网页端。电商专业,网络营销推广或移动营销课程中所说的M站,指的是HTML5制作的网页,开发门槛低、兼容性强,占存小,无需安装。
比如 http://m.jd.com 一般来说,一般m站都以m开头后接域名
所以!!!
你看看这个:
https://m.weibo.cn/
2.重庆微博地铁客运量爬虫
m站微博主页,这种大大的摆着。。。
还需要登录嘛?妈蛋。
目标地址:
https://m.weibo.cn/search?containerid=231522type%3D1%26t%3D10%26q%3D%23%E6%98%A8%E6%97%A5%E5%AE%A2%E8%BF%90%E9%87%8F%23&isnewpage=1
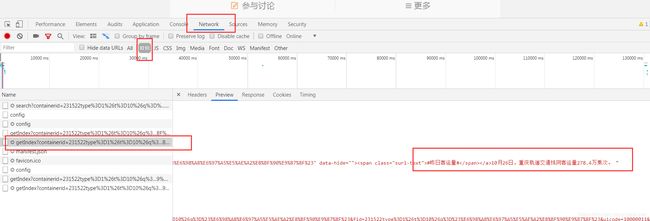
这个是首页的数据:
抓取的内容包括:微博发布的时间,正文(仅提取文字),转发数,评论数,点赞数
data
cards
mblog
created_at # 发布时间
text # 正文
reposts_count # 转发数
comments_count # 评论数
attitudes_count # 点赞数
https://m.weibo.cn/api/container/getIndex?containerid=231522type%253D1%2526t%253D10%2526q%253D%2523%25E6%2598%25A8%25E6%2597%25A5%25E5%25AE%25A2%25E8%25BF%2590%25E9%2587%258F%2523&isnewpage=1&luicode=10000011&lfid=1076032152519810&type=uid&page_type=searchall&page=1
发现除了page参数的不同,其他都是一致的
所以,url是需要拼接的。
整个代码如下:
#!/usr/bin/python3
import datetime
import requests
from urllib.parse import urlencode
from pyquery import PyQuery as pq
import json

host = 'm.weibo.cn'
base_url = 'https://%s/api/container/getIndex?' % host
user_agent = 'User-Agent: Mozilla/5.0 (iPhone; CPU iPhone OS 9_1 like Mac OS X) AppleWebKit/601.1.46 (KHTML, like Gecko) Version/9.0 Mobile/13B143 Safari/601.1 wechatdevtools/0.7.0 MicroMessenger/6.3.9 Language/zh_CN webview/0'

headers = {
    'Host': host,
    'Referer': 'https://m.weibo.cn/u/2803301701',
    'User-Agent': user_agent
}

# 按页数抓取数据,返回json数据
def get_single_page(page):
    params = {
        'containerid': '231522type%3D1%26t%3D10%26q%3D%23%E6%98%A8%E6%97%A5%E5%AE%A2%E8%BF%90%E9%87%8F%23',
        'isnewpage':1,
        'luicode':10000011,
        'lfid':1076032152519810,
        'type': 'uid',
        'page_type':'searchall',
        'page': page
    }
    url = base_url + urlencode(params)
    print('爬取第%d页的URL:%s' %(page,url))
    try:
        response = requests.get(url, headers=headers)
        if response.status_code == 200:
            #print(response.json())
            return response.json()
    except requests.ConnectionError as e:
        print('抓取错误,URL异常。', e.args)


# 解析html页面返回的json数据
def parse_page(json):
    items = json.get('data').get('cards')
    #print('目前微博话题为:',items)

    for item in items:
        item = item.get('mblog')
        #print(item)
        if item:
            data = {
                'id':item.get('id'),
                'text': pq(item.get("text")).text().replace('#','').replace('昨日客运量',''),  # 仅提取内容中的文本
                'created_at': item.get('created_at'),   # 发布时间
                ' reposts_count': item.get(' reposts_count'),  # 转发量
                'comments_count': item.get('comments_count'),  # 评论量
                'attitudes_count': item.get('attitudes_count')  # 点赞量
                    # 还需要存什么数据就在这添加。。。
            }
            yield data


# 本地输出一份
def write_to_file(result):
    #print('dict对象',type(result))
    with open('result.txt','a',encoding='utf-8') as f:
        f.write(json.dumps(result,ensure_ascii=False)+'\n')  #将字典或列表转为josn格式的字符串


# 入库
import pymysql
def save_data_sql(content):
    #print(type(content),content) # dict对象
    #print('对应的是:', content[' reposts_count'])  # 原字段有一个空格。看了微博的程序员不认真了.
    if content[' reposts_count'] is None:
        content[' reposts_count'] = '0'         # 数据库中None是关键字没法存。
    try:
        # 打开数据库连接
        conn = pymysql.connect(host='localhost',user='root',password='root',db='py_zljob')
        # 使用 cursor() 方法创建一个游标对象 cursor
        mycursor = conn.cursor()

        sql = "INSERT INTO weibokll(id,text,created_at,reposts_count,comments_count,attitudes_count) \
               VALUES (%s,%s,%s,%s,%s,%s)"
        params = (content['id'],content['text'],content['created_at'],content[' reposts_count'],content['comments_count'],content['attitudes_count'])

        # 调用
        mycursor.execute(sql,params)
        #sql='select * from weibokll'
        # 执行sql语句
        conn.commit()
        # 获取所有记录列表
        # results = mycursor.fetchall()
        # for row in results:
        #     print(row)
        print('数据储存成功,共', mycursor.rowcount, '条数据!')
    except Exception:
        # 发生错误时回滚
        conn.rollback()
        print('发生异常')
    # 关闭数据库连接
    mycursor.close()
    conn.close()


# 转换日期提取和客运量提纯
def getdateandflow(date1):
    #print("============提纯时间==================")
    global year1  # 使用global声明-把year1定为全局变量

    if date1.find('月') != -1:
        date1=date1.replace('月',';')
        date1=date1.replace('日',';')
        list2=date1.split(';')
        if '1' == list2[0] and '2' ==  list2[1]:
            year1=year1-1
            date2=str(year1)+'-'+list2[0]+'-'+list2[1]
        else:
            date2=str(year1)+'-'+list2[0]+'-'+list2[1]
        date3 = datetime.datetime.strptime(date2,'%Y-%m-%d').date()
        #print(date3)
        # 放入字典自动变为:{'data': datetime.date(2019, 10, 28)}
        dt_str = date3.strftime('%Y-%m-%d')  # 处理一下

        #print("============提纯客运量===============")
        # 11月5日,重庆轨道交通线网客运量300.2万乘次。
        import re
        kyl = str(re.findall(r"量(.+?)万", date1)).replace("'", "").replace(r'[','').replace(r']','')
        #print(kyl, type(kyl),len(kyl))

        return dt_str,kyl
    else:
        print('日期转换出错。')
        return None


# 数据可视化
def showdata(sqldata):
    from pyecharts.charts import Bar  # 注意,新版本中,Bar被放进了charts
    from pyecharts import options as opts

    # 柱状图
    bar = Bar()
    # x为发布日期,y为客运量 间隔
    bar.add_xaxis(sqldata["data"])
    bar.add_yaxis("总客运量", sqldata['kyl'],category_gap="50%")
    # 基本设置
    bar.set_global_opts(title_opts=opts.TitleOpts(title="重庆地铁客运量分析图"),
                        yaxis_opts=opts.AxisOpts(name="客运量(单位:万次)"),  # 设置y轴名字,x轴同理
                        xaxis_opts=opts.AxisOpts(name="发布日期"),
                        datazoom_opts = opts.DataZoomOpts()  # 设置水平缩放,默认可滑动(*好东西)
                    )
    # 标记峰值
    bar.set_series_opts(
        label_opts=opts.LabelOpts(is_show=True),
        markpoint_opts=opts.MarkPointOpts(
            data=[
                opts.MarkPointItem(type_='max', name='最大值'),  # 最大值标记点
                opts.MarkPointItem(type_='min', name='最小值'),  # 最小值标记点
                opts.MarkPointItem(type_='average', name='平均值')  # 平均值标记点
            ]
        )
    )

    bar.render('render.html')  # 输出为html


if __name__ == '__main__':

    year1=2019  # 默认去爬2019年的
    today=[]
    keyun=[]
    print('==========当前默认为爬取2019年的数据==========')
    startpage = eval(input('请输入要爬取的页数:'))
    for page in range(1, startpage):  # 抓取前十页的数据
        json_html = get_single_page(page)
        results = parse_page(json_html)
        #print('generator对象',type(results))

        for result in results:
            #print('筛选后的最终数据为:',result)
            write_to_file(result)           # 生成器对象一遍历出来就是字典。
            #save_data_sql(result)

            dt_str,kyl = getdateandflow(result.get('text'))  # 拿到日期和客运量的数据
            today.append(dt_str)
            keyun.append(kyl)
    # 组合kv
    sqldata = {
        'data': today,
        'kyl': keyun
    }
    #print('========形成格式======', sqldata, type(sqldata),len(sqldata))
    showdata(sqldata)
    print('本地数据备份成功。')
    print('==========~~~爬取完毕,快去看分析图吧~~~==========')
效果:
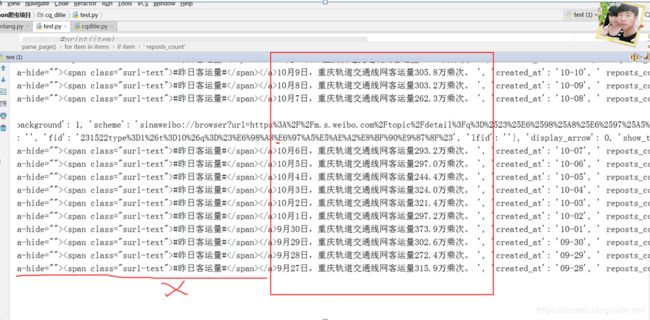
一开始出来的数据是这样:
爬取的最终数据为: {'id': '4424683049199915', 'text': '#昨日客运量#10月6日,重庆轨道交通线网客运量293.2万乘次。 ', 'created_at': '10-07', ' reposts_count': None, 'comments_count': 22, 'attitudes_count': 37}
从text标签中过滤掉,只取text。
Bs4的渣渣,写不了,后面查百度,用了这个PyQuery。
from pyquery import PyQuery as pq
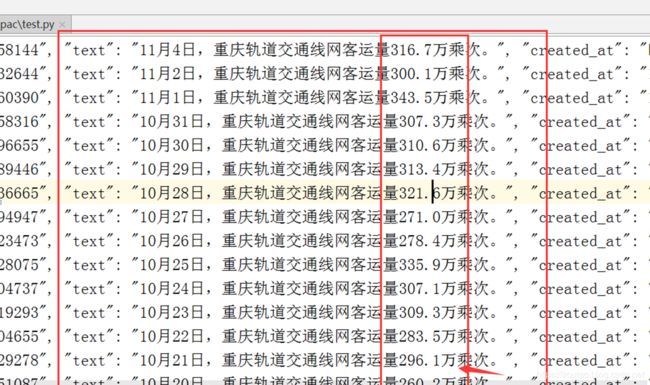
爬取的最终数据为:
{'id': '4422148925803681', 'text': '#昨日客运量#9月29日,重庆轨道交通线网客运量302.6万乘次。', 'created_at': '09-30', ' reposts_count': None, 'comments_count': 48, 'attitudes_count': 40}
替换做一下处理。
‘text’: pq(item.get(“text”)).text().replace(’#’,’’).replace(‘昨日客运量’,’’), # 仅提取内容中的文本
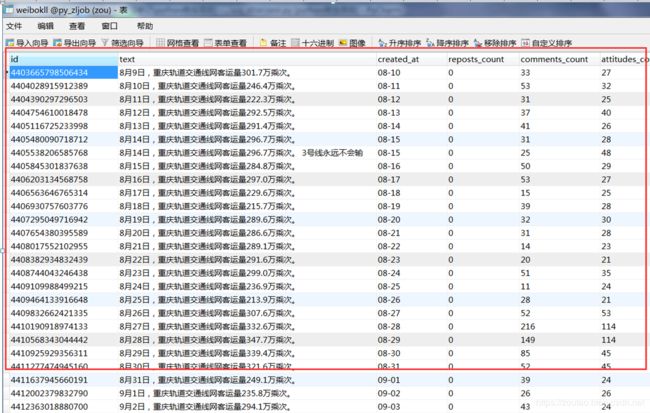
以日期为唯一索引,将当日的所有客流数据存入Mysql中:
把客运量提出来:
存入数据库:
数据库建表:
整个有点麻烦,解释都不好解释,代码中写了注释,需要的看了,不懂留言。
移动APP和M站的区别:
https://www.jianshu.com/p/85b8485dcab9
重庆客运量项所有参考地址和模板页面:
https://www.jianshu.com/p/5d1061f09a1f?utm_source=oschina-app
https://www.jianshu.com/p/c4ef31a0ea8c
https://m.weibo.cn/search?containerid=231522type%3D1%26t%3D10%26q%3D%23%E6%98%A8%E6%97%A5%E5%AE%A2%E8%BF%90%E9%87%8F%23&isnewpage=1&luicode=10000011&lfid=1076032152519810
https://m.weibo.cn/api/container/getIndex?containerid=231522type%253D1%2526t%253D10%2526q%253D%2523%25E6%2598%25A8%25E6%2597%25A5%25E5%25AE%25A2%25E8%25BF%2590%25E9%2587%258F%2523&isnewpage=1&luicode=10000011&lfid=1076032152519810&type=uid&page_type=searchall&page=1
file:///F:/python_%E5%AD%A6%E4%B9%A0%E7%AC%94%E8%AE%B0/python%E7%88%AC%E8%99%AB%E9%A1%B9%E7%9B%AE/cq_ditie/render.html


