梯度下降 Python
Gradient Descent
Today, I’m going to try this method to solve a linear regression problem.
Function can be written as:
h ( θ ) = θ 0 + θ 1 x h(\theta)=\theta_0+\theta_1x h(θ)=θ0+θ1x
The cost function, “Squared error function”, or “Mean squared error” is:
J ( θ 0 , θ 1 ) = 1 2 m ∑ i = 1 m = 1 2 m ( y i ^ − y i ) 2 = 1 2 m ( h θ ( x i ) − y i ) 2 J(θ_0,θ_1)=\frac{1}{2}m\sum_{i=1}^m=\frac{1}{2m}(\hat{y_i}−y_i)^2=\frac{1}{2m}(h_\theta(x_i)−y_i)^2 J(θ0,θ1)=21mi=1∑m=2m1(yi^−yi)2=2m1(hθ(xi)−yi)2
Iterate until function J ( θ ) J(\theta) J(θ) to
M i n J ( θ 0 , θ 1 ) Min J(θ_0,θ_1) MinJ(θ0,θ1)
Iterate by:
θ j : = θ j − α ∂ ∂ θ j J ( θ 0 , θ 1 ) \theta_j := \theta_j - \alpha \frac{\partial}{\partial \theta_j}J(θ_0,θ_1) θj:=θj−α∂θj∂J(θ0,θ1)
“:=” means renew the value.
Import
import numpy as np
import pandas as pd
import matplotlib.pyplot as plt
from mpl_toolkits.mplot3d import axes3d
from sklearn import preprocessing
import warnings
%matplotlib inline
%config InlineBackend.figure_format = 'retina'
warnings.filterwarnings('ignore')

data = pd.read_csv("./Salary_Data.csv")
display(data)
| YearsExperience | Salary | |
|---|---|---|
| 0 | 1.1 | 39343.0 |
| 1 | 1.3 | 46205.0 |
| 2 | 1.5 | 37731.0 |
| 3 | 2.0 | 43525.0 |
| 4 | 2.2 | 39891.0 |
| 5 | 2.9 | 56642.0 |
| 6 | 3.0 | 60150.0 |
| 7 | 3.2 | 54445.0 |
| 8 | 3.2 | 64445.0 |
| 9 | 3.7 | 57189.0 |
| 10 | 3.9 | 63218.0 |
| 11 | 4.0 | 55794.0 |
| 12 | 4.0 | 56957.0 |
| 13 | 4.1 | 57081.0 |
| 14 | 4.5 | 61111.0 |
| 15 | 4.9 | 67938.0 |
| 16 | 5.1 | 66029.0 |
| 17 | 5.3 | 83088.0 |
| 18 | 5.9 | 81363.0 |
| 19 | 6.0 | 93940.0 |
| 20 | 6.8 | 91738.0 |
| 21 | 7.1 | 98273.0 |
| 22 | 7.9 | 101302.0 |
| 23 | 8.2 | 113812.0 |
| 24 | 8.7 | 109431.0 |
| 25 | 9.0 | 105582.0 |
| 26 | 9.5 | 116969.0 |
| 27 | 9.6 | 112635.0 |
| 28 | 10.3 | 122391.0 |
| 29 | 10.5 | 121872.0 |
Preprocessing
The scale of the data is too big, so we need to normalize them by:
z = x − m i n ( x ) m a x ( x ) − m i n ( x ) z = \frac{x-min(x)}{max(x)-min(x)} z=max(x)−min(x)x−min(x)
x = data.values[:, 0]
y = data.values[:, 1]
x = preprocessing.normalize([x]).T
y = preprocessing.normalize([y]).T
Functions
Then define some functinos:
def h(t0, t1):
    '''linear function'''
    return t0 + t1 * x


def J(t0, t1):
    '''cost function'''
    sum = 0.5 * (1 / len(x)) * np.sum(np.power((t0 + t1 * x) - y, 2))
    return sum


def gd(t0, t1, alpha, n_iter):
    '''main function'''
    theta = [t0, t1]
    temp = np.array([t0, t1])
    cost = []

    k = 0
    while True:
        t0 = theta[0] - alpha * (1 / len(x)) * np.sum((theta[0] + theta[1] * x) - y)
        t1 = theta[1] - alpha * (1 / len(x)) * np.sum(((theta[0] + theta[1] * x) - y) * x)
        theta = [t0, t1]
        cost.append(J(t0, t1))
        temp = np.vstack([temp, theta])
        k += 1
        if k >= n_iter:
            break
    return cost, temp, theta
Output
cost, temp, theta = gd(0, 1, 1, 500)
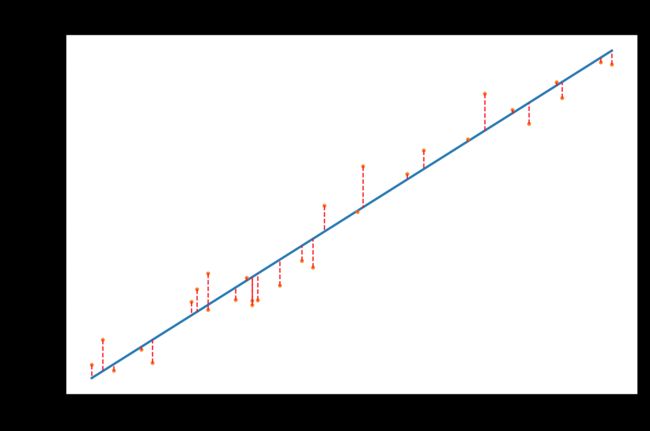
print("The result is: h = %.2f + %.2f * x" % (theta[0], theta[1]))
yh = h(theta[0], theta[1])
fig1 = plt.figure(dpi=150)
plt.plot(x, yh)
plt.plot(x, y, 'o', markersize=1.5)
for i in range(len(x)):
    plt.plot([x[i], x[i]], [y[i], yh[i]], "r--", linewidth=0.8)
plt.title("Fit")
plt.tight_layout()
plt.show()
The result is: h = 0.06 + 0.71 * x
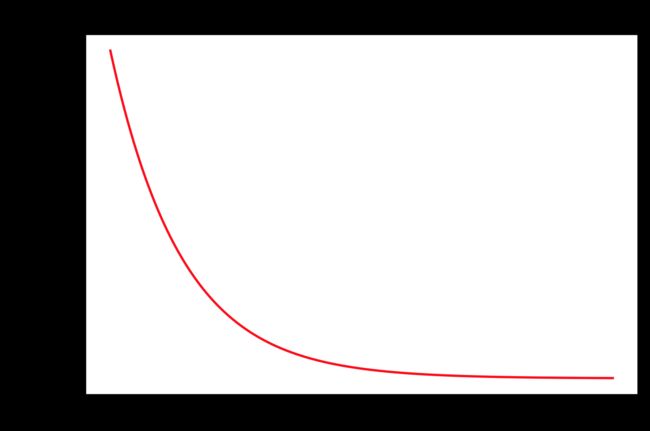
fig2 = plt.figure(dpi=150)
plt.plot(range(len(cost)), cost, 'r')
plt.title("Cost Function")
plt.tight_layout()
plt.show()
Compared to Normal Equation
θ = ( X T X ) − 1 X T y \theta = (X^T X)^{-1} X^T y θ=(XTX)−1XTy
X = x
X.shape
(30, 1)
one = np.ones((30, 1))
one.shape
X = np.concatenate([one, X], axis=1)
(30, 1)
theta = np.linalg.pinv(X.T @ X) @ X.T @ y
theta
array([[0.05839456],
       [0.70327706]])
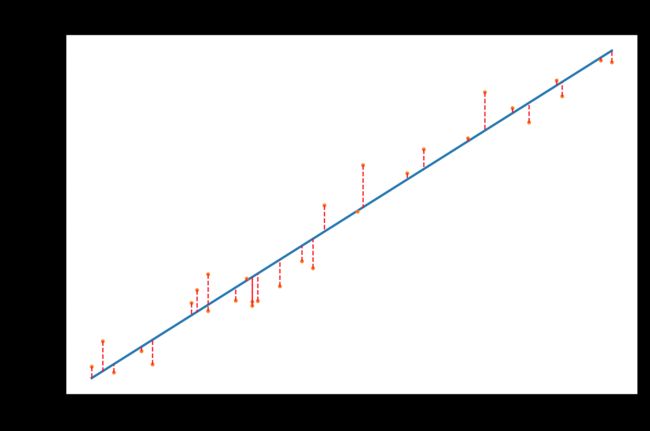
print("The result is: h = %.2f + %.2f * x" % (theta[0], theta[1]))
yh = h(theta[0], theta[1])
fig1 = plt.figure(dpi=150)
plt.plot(x, yh)
plt.plot(x, y, 'o', markersize=1.5)
for i in range(len(x)):
    plt.plot([x[i], x[i]], [y[i], yh[i]], "r--", linewidth=0.8)
plt.title("Fit")
plt.tight_layout()
plt.show()
The result is: h = 0.06 + 0.70 * x
print("gd cost:", cost[-1])
print("ne cost:", J(theta[0], theta[1]))
gd cost: 8.042499159722341e-05
ne cost: 8.014548878265756e-05


