SVM支持向量机算法原理详解及人脸识别实战
一、先利用库简单的来了解一下流程
1. 代码
from sklearn import svm

x = [[2,0],
    [1,1],
    [2,5]]
y = [0,0,1]

# 选择核
clf = svm.SVC(kernel='linear')
# 建立模型
clf.fit(x, y)

# 模型带有很多的参数, 可以自己进行调整
print(clf)
# 得到支持向量点的索引,就是离线最近的两个分类中的点
print(clf.support_)
#获取每一个分类中支持向量的个数
print(clf.n_support_)


# 进行预测
print(clf.predict([[2,4]]))
2. 结果
# clf, 一个分类器的调节的参数
SVC(C=1.0, cache_size=200, class_weight=None, coef0=0.0,
    decision_function_shape='ovr', degree=3, gamma='auto_deprecated',
    kernel='linear', max_iter=-1, probability=False, random_state=None,
    shrinking=True, tol=0.001, verbose=False)

# 得到支持向量点的索引,就是离线最近的两个分类中的点
[1 2]
#获取每一个分类中支持向量的个数
[1 1]
#预测的结果
[1]
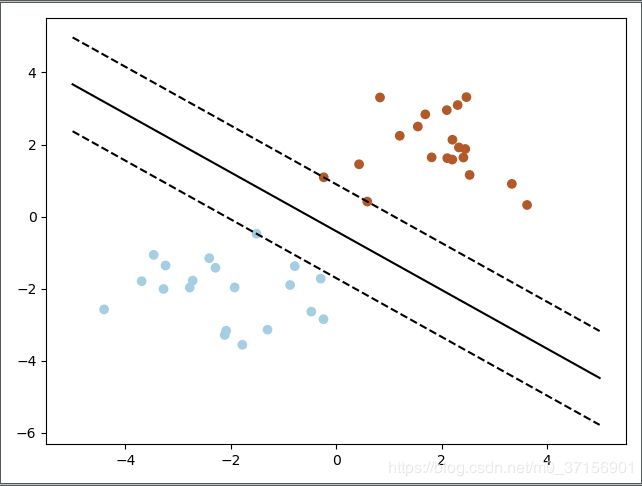
二、来个稍微复杂的,并画出线
2.1代码
import numpy as np
import pylab as pl
from sklearn import svm

# 1. 创建40个点
X = np.r_[np.random.randn(20,2) - [2, 2], np.random.randn(20, 2) + [2, 2]]
Y = [0] * 20 + [1]*20

# 2. 建立训练出模型
clf = svm.SVC(kernel='linear')
clf.fit(X, Y)

# 3. 获取训练出来的参数 - 超平面
w = clf.coef_[0]
a = -w[0]/w[1]
xx = np.linspace(-5, 5)
yy = a*xx - (clf.intercept_[0])/w[1]

# 4. 画出平行线
b = clf.support_vectors_[0]
yy_down = a*xx + (b[1] - a*b[0])
b = clf.support_vectors_[-1]
yy_up = a*xx + (b[1] - a*b[0])

print("w : ", w)
print("a : ", a)

print("xx : ", xx)
print("yy : ", yy)

print("clf.support_vectors_ : ", clf.support_vectors_)
print("clf.coef_ : ", clf.coef_)

# switching to the generic n-dimensional parameterization of the hyperplan to the 2D-specific equation
# of a line y=a.x +b: the generic w_0x + w_1y +w_3=0 can be rewritten y = -(w_0/w_1) x + (w_3/w_1)

# plot the line, the points, and the nearest vectors to the plane
pl.plot(xx, yy, 'k-')
pl.plot(xx, yy_down, 'k--')
pl.plot(xx, yy_up, 'k--')

# 为每一个点指定大小和颜色
pl.scatter(clf.support_vectors_[:, 0], clf.support_vectors_[:, 1],
          s=80, facecolors='none')
pl.scatter(X[:, 0], X[:, 1], c=Y, cmap=pl.cm.Paired)

pl.axis('tight')
pl.show()
2.2 运行结果
w :  [0.62585066 0.76808981]
a :  -0.8148144330888917
xx :  [-5.         -4.79591837 -4.59183673 -4.3877551  -4.18367347 -3.97959184
 -3.7755102  -3.57142857 -3.36734694 -3.16326531 -2.95918367 -2.75510204
 -2.55102041 -2.34693878 -2.14285714 -1.93877551 -1.73469388 -1.53061224
 -1.32653061 -1.12244898 -0.91836735 -0.71428571 -0.51020408 -0.30612245
 -0.10204082  0.10204082  0.30612245  0.51020408  0.71428571  0.91836735
  1.12244898  1.32653061  1.53061224  1.73469388  1.93877551  2.14285714
  2.34693878  2.55102041  2.75510204  2.95918367  3.16326531  3.36734694
  3.57142857  3.7755102   3.97959184  4.18367347  4.3877551   4.59183673
  4.79591837  5.        ]
yy :  [ 3.67069705  3.50440839  3.33811973  3.17183107  3.00554241  2.83925375
  2.67296509  2.50667643  2.34038777  2.17409911  2.00781045  1.84152179
  1.67523313  1.50894448  1.34265582  1.17636716  1.0100785   0.84378984
  0.67750118  0.51121252  0.34492386  0.1786352   0.01234654 -0.15394212
 -0.32023078 -0.48651944 -0.6528081  -0.81909676 -0.98538542 -1.15167408
 -1.31796274 -1.4842514  -1.65054006 -1.81682872 -1.98311738 -2.14940604
 -2.3156947  -2.48198336 -2.64827202 -2.81456068 -2.98084934 -3.147138
 -3.31342666 -3.47971532 -3.64600398 -3.81229264 -3.9785813  -4.14486996
 -4.31115862 -4.47744728]
clf.support_vectors_ :  [[-1.5102335  -0.47474615]
 [-0.2351354   1.0901477 ]]
clf.coef_ :  [[0.62585066 0.76808981]]
三、* 解决难题 - 线性不可分和核函数问题
3.1原理讲解
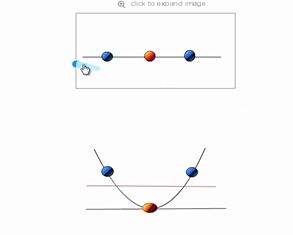
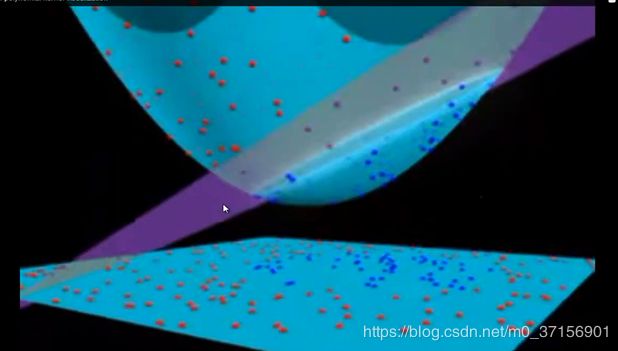
2.2.3 视觉化演示 https://www.youtube.com/watch?v=3liCbRZPrZA
多类: 转化为多个二分类问题来循环处理
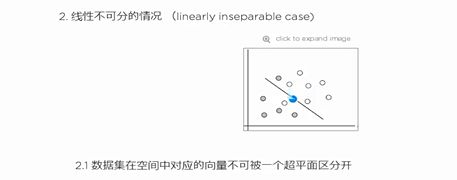
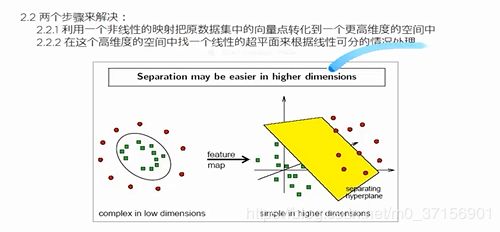
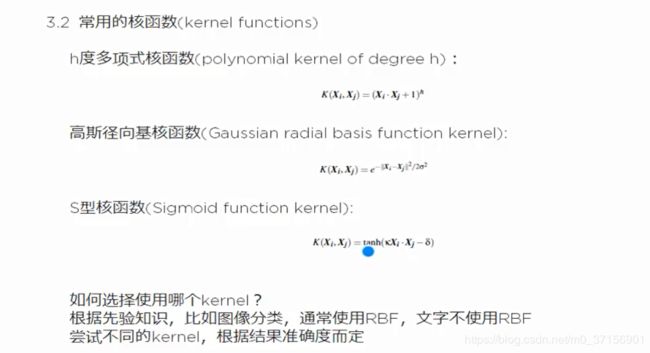
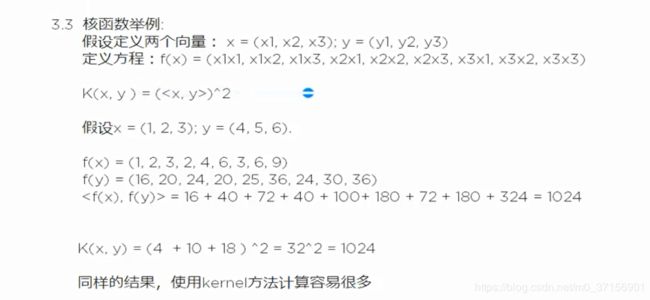
线性不可分: 转化为高维
3.2 代码实战人脸识别
from __future__ import print_function

from time import time
import logging
import matplotlib.pyplot as plt

from sklearn.cross_validation import train_test_split
from sklearn.datasets import fetch_lfw_people
from sklearn.grid_search import GridSearchCV
from sklearn.metrics import classification_report
from sklearn.metrics import confusion_matrix
from sklearn.decomposition import RandomizedPCA
from sklearn.svm import SVC


print(__doc__)

# Display progress logs on stdout
logging.basicConfig(level=logging.INFO, format='%(asctime)s %(message)s')


###############################################################################
# Download the data, if not already on disk and load it as numpy arrays

lfw_people = fetch_lfw_people(min_faces_per_person=70, resize=0.4)

# introspect the images arrays to find the shapes (for plotting)
n_samples, h, w = lfw_people.images.shape

# for machine learning we use the 2 data directly (as relative pixel
# positions info is ignored by this model)
X = lfw_people.data
# 返回矩阵的列数 - 特征数
n_features = X.shape[1]

# the label to predict is the id of the person
y = lfw_people.target
target_names = lfw_people.target_names
# 有多少个类
n_classes = target_names.shape[0]

print("Total dataset size:")
print("n_samples: %d" % n_samples)
print("n_features: %d" % n_features)
print("n_classes: %d" % n_classes)


###############################################################################
# Split into a training set and a test set using a stratified k fold

# split into a training and testing set
# 自带的分数据的函数 - 两个矩阵和两个向量
X_train, X_test, y_train, y_test = train_test_split(
    X, y, test_size=0.25)


###############################################################################
# Compute a PCA (eigenfaces) on the face dataset (treated as unlabeled
# dataset): unsupervised feature extraction / dimensionality reduction
n_components = 150

print("Extracting the top %d eigenfaces from %d faces"
      % (n_components, X_train.shape[0]))
t0 = time()
pca = RandomizedPCA(n_components=n_components, whiten=True).fit(X_train)
print("done in %0.3fs" % (time() - t0))

# 这个变量保存了人脸的特征值 - 可深究
eigenfaces = pca.components_.reshape((n_components, h, w))

print("Projecting the input data on the eigenfaces orthonormal basis")
t0 = time()
# 完成降维工作
X_train_pca = pca.transform(X_train)
X_test_pca = pca.transform(X_test)
print("done in %0.3fs" % (time() - t0))


###############################################################################
# Train a SVM classification model

print("Fitting the classifier to the training set")
t0 = time()
# svm自带的参数,5 x 6 = 30种组合,多次尝试
param_grid = {'C': [1e3, 5e3, 1e4, 5e4, 1e5],
              'gamma': [0.0001, 0.0005, 0.001, 0.005, 0.01, 0.1], }
clf = GridSearchCV(SVC(kernel='rbf', class_weight='auto'), param_grid)
clf = clf.fit(X_train_pca, y_train)
print("done in %0.3fs" % (time() - t0))
print("Best estimator found by grid search:")
print(clf.best_estimator_)


###############################################################################
# Quantitative evaluation of the model quality on the test set

print("Predicting people's names on the test set")
t0 = time()
y_pred = clf.predict(X_test_pca)
print("done in %0.3fs" % (time() - t0))

print(classification_report(y_test, y_pred, target_names=target_names))
#
print(confusion_matrix(y_test, y_pred, labels=range(n_classes)))


###############################################################################
# Qualitative evaluation of the predictions using matplotlib

# 1. 传入图片 展览
def plot_gallery(images, titles, h, w, n_row=3, n_col=4):
    """Helper function to plot a gallery of portraits"""
    plt.figure(figsize=(1.8 * n_col, 2.4 * n_row))
    plt.subplots_adjust(bottom=0, left=.01, right=.99, top=.90, hspace=.35)
    for i in range(n_row * n_col):
        plt.subplot(n_row, n_col, i + 1)
        plt.imshow(images[i].reshape((h, w)), cmap=plt.cm.gray)
        plt.title(titles[i], size=12)
        plt.xticks(())
        plt.yticks(())


# plot the result of the prediction on a portion of the test set

def title(y_pred, y_test, target_names, i):
    pred_name = target_names[y_pred[i]].rsplit(' ', 1)[-1]
    true_name = target_names[y_test[i]].rsplit(' ', 1)[-1]
    return 'predicted: %s\ntrue:      %s' % (pred_name, true_name)

# 保存预测的人名
prediction_titles = [title(y_pred, y_test, target_names, i)
                     for i in range(y_pred.shape[0])]

plot_gallery(X_test, prediction_titles, h, w)

# plot the gallery of the most significative eigenfaces

eigenface_titles = ["eigenface %d" % i for i in range(eigenfaces.shape[0])]
plot_gallery(eigenfaces, eigenface_titles, h, w)

plt.show()
3.3结果展示
四、知识点补充
4.1 svm模型参数详解
# 这是输出一个模型的时候数据,分别是训练完成的参数, 下面详细解析一下
SVC(C=1.0, cache_size=200, class_weight=None, coef0=0.0,
  decision_function_shape='ovr', degree=3, gamma='auto_deprecated',
  kernel='linear', max_iter=-1, probability=False, random_state=None,
  shrinking=True, tol=0.001, verbose=False)

SVC() : SVM的类型,
        0 -- C-SVC
        1 -- nu-SVC
        2 -- one-class SVM
        3 -- epsilon-SVR
        4 -- nu-SVR


C=1.0,
cache_size=200,
class_weight=None,

# coef0:核函数中的coef0设置(针对多项式/sigmoid核函数)((默认0)
coef0=0.0,

decision_function_shape='ovr',
degree=3, gamma='auto_deprecated',
kernel='linear',
 max_iter=-1,
probability=False,
random_state=None,
shrinking=True,
tol=0.001,
verbose=False
