详解:利用最近邻法对图像进行分类
整体介绍
本算法利用最近邻法利用cifar-10图像数据库进行测试,对未知图像进行分类
整体步骤
1、算法介绍:本小节介绍最近邻方法的理论及其相关知识
2、数据库和数据:数据库的内容和单个数据的表现
3、程序:利用程序实现对图像的分类
4、结果展示
算法介绍
数据库与数据
这里有详细介绍:cifar-10官网
先问一个问题:图像的二维数据怎么储存的,以及图像的groundtruth(真实标签)怎么储存?
注意:我们不仅要注意模型,更要注意我们的数据如何获取。
这个数据集是图像数据集。
每张图像大小是:32*32。
分为10类,每一类有6000张图片。(10类分为:airplane,automobile, bird, cat, deer, dog, frog, horse, ship, truck)
存储的数据格式有多种。这里用python中的数据格式为例。
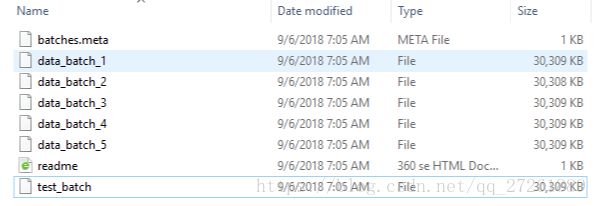
首先,数据下有几个文件,如图

分为五个训练数据和一个测试数据集,这六个数据集相同大小,可以看见他们所占内存相同。
再来说一下这里面单个数据,以test_batch为例。
图像大小是32*32,这是彩色图像即三通道(再乘以3),也就是说一个图像需要32*32*3 = 3072个数据表示。
我们先将图片的数据展开成一行,也就是1*3072(先行后列)。前1024个数据是red,接着是绿色,最后是蓝色。
因此n*3072就表示有n张图片。(所有图片按照相同的方式进行排列)
以上组成data.
data和标签按照字典的方式进行匹配。
与data对应的就是label。
一个单独的图像用0-9表示对应的分类。
总的来说,数据库由data和label组成,两者通过字典的方式关联。
data是图像数据,一行表示一个图片,先是R通道,最后是B通道;label表示分类。
data的格式是n*3072,
label的格式就是n*1。
至于label中0表示什么类,9又是什么类,可以见另一文件:batches.meta。
以下介绍以下程序怎么读取数据
def loadCifar10(filename):
    with open(filename, "rb") as f:
        datadict = pickle.load(f, encoding='latin1')
        X = datadict['data']
        Y = datadict['labels']
        X = X.reshape(10000, 3, 32, 32).transpose(0, 2, 3, 1).astype("float")
        Y = np.array(Y)
        return X, Y
以上就是python3对应的版本的读取方式。是一个函数的读取方式,函数输入是要打开的文件名字。
from six.moves import cPickle as pickle,这是需要导入的模块。这一步我们暂时不解释。
可以看到我们一旦得到了datadict数据,就按照字典的方式读取,其中图像数据X就是data,而标签Y就是labels。
然后再将X进行重新排列成图像格式。
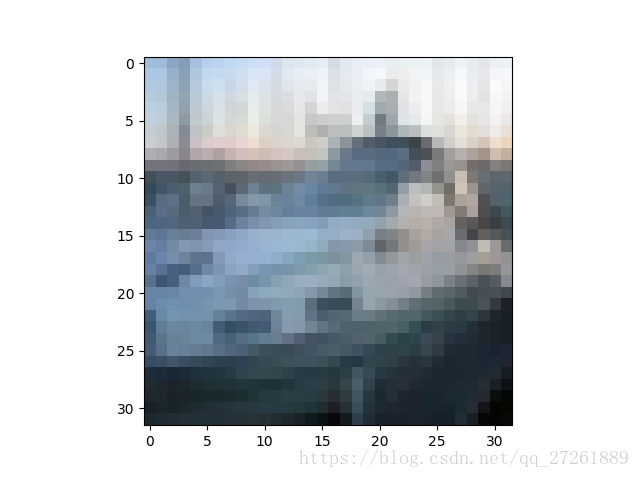
最后还会展示一个图片,完整代码可以看最后。这里只是一个定义。

#! usr/bin/env python
#  coding = utf-8

import numpy as np
from six.moves import cPickle as pickle
import os
import matplotlib.pyplot as plt

# reading data
def loadCifar10(filename):
    with open(filename, "rb") as f:
        datadict = pickle.load(f, encoding='latin1')
        X = datadict['data']
        Y = datadict['labels']
        X = X.reshape(10000, 3, 32, 32).transpose(0, 2, 3, 1).astype("float")
        Y = np.array(Y)
        return X, Y

# testing a new image
# # testing many new images

if __name__ == '__main__':
    root = os.getcwd()
    trainDataRoot = os.path.join(root, 'cifar-10-batches-py/data_batch_1')
    trainDataX, trainLabelY = loadCifar10(trainDataRoot)
    numTrain = trainDataX.shape[0]

    testDataRoot = os.path.join(root, 'cifar-10-batches-py/test_batch')
    testDataX, testLabelY = loadCifar10(testDataRoot)
    testOneX = testDataX[2,:]
    # print(testOneX.shape)
    # print(type(testOneX))
    testOneX = np.uint8(testOneX)
    plt.imshow(testOneX)
    plt.show()
*我们还要注意,为了展示图片和进行训练和分类测试的数据格式可以与这里的展示图片的格式不同。*
程序
基本要求:python3.6+pycharm
另外,还需要下载一下数据并解压。把整个文件夹放在当前文件夹下。
注意:计算距离这一步需要很长时间,这也就是最近邻法在图像分类中的问题(训练时间很少,测试时间很长)
以下是测试程序,分为四步。
#! usr/bin/env python
#  coding = utf-8

import numpy as np
from six.moves import cPickle as pickle
import os
import matplotlib.pyplot as plt

# reading data
def loadCifar10(filename):
    with open(filename, "rb") as f:
        datadict = pickle.load(f, encoding='latin1')
        X = datadict['data']
        Y = datadict['labels']
        X = X.reshape(10000, 3, 32, 32).transpose(0, 2, 3, 1).astype("float")
        Y = np.array(Y)
        return X, Y

def loadCifar10_forTest(filename):
    with open(filename, 'rb') as f:
        datadict = pickle.load(f, encoding='latin1')
        X = datadict['data']
        Y = datadict['labels']
        X = X.reshape(10000, 3072).astype("float")
        Y = np.array(Y)
        return X, Y

# testing a new image
# # testing many new images

if __name__ == '__main__':
    root = os.getcwd()

    # for show img
    '''
    trainDataRoot = os.path.join(root, 'cifar-10-batches-py/data_batch_1')
    trainDataX, trainLabelY = loadCifar10(trainDataRoot)
    numTrain = trainDataX.shape[0]

    testDataRoot = os.path.join(root, 'cifar-10-batches-py/test_batch')
    testDataX, testLabelY = loadCifar10(testDataRoot)
    testOneX = testDataX[2,:]
    # print(testOneX.shape)
    # print(type(testOneX))
    testOneX = np.uint8(testOneX)
    plt.imshow(testOneX)
    plt.show()
    '''

    # for classifing
    # first step: reading data for training and testing
    trainDataRoot = os.path.join(root, 'cifar-10-batches-py/data_batch_1')
    trainDataX, trainLabelY = loadCifar10_forTest(trainDataRoot)
    # 此时,trainDataX是一个10000*3072的数据,每一行代表一个图片,共有10000张图片
    # 对应的,trainLabelY是一个10000*1的数据,每一行代表一个图片的标定分类

    testDataRoot = os.path.join(root, 'cifar-10-batches-py/test_batch')
    testDataX, testLabelY = loadCifar10_forTest(testDataRoot)
    # print(testDataX.shape)
    # 此时,testDataX是一个10000*3072的数据,也就是说我们有10000张图片需要测试
    # 将这10000张图片进行分类,要考虑效率问题,注意到循环是我们尽量要避免的东西。

    # second step: compute the distance
    number_train = trainDataX.shape[0]
    number_test = testDataX.shape[0]
    distances = np.zeros((number_test, number_train))

    for i in range(number_test):# 用L2计算距离
        # 这里请务必考虑数据结构
        distances[i] = np.sqrt(np.sum(np.square(trainDataX - testDataX[i,:]), axis=1))
        # 按行进行累积求和,而相减则可以自动按照行进行(python机制)
        # distances[i][j]表示test[i,:]和train[j,:]的距离
        # 我们可以根据distances每一行选出与当前test图像距离最近的一个

        # 注意到,这里有一个循环,个人认为一个循环容易理解速度也比较好。没有循环的有点难以理解和两层循环则非常慢。
        # 这里就不给出另外两种方法了,感兴趣的可以私信我。


    # third step: classify the test image according to the distances
    # 这里采用1近邻法预测
    number_test = testDataX.shape[0]
    predict = np.zeros((number_test, 1))
    # 需要考虑到最近的点不是一个的问题(这里没有考虑)
    for i in range(number_test):
        closeDistancesIndex = np.argsort(distances[i,:])[0] # 找到与测试图像距离最近的图像的索引
        lableRelated = trainLabelY[closeDistancesIndex] # 根据索引找到对应图像的标签
        predict[i] = lableRelated # 得到最后结果


    # fourth step: compute the predict accuracy
    accuracy = 0
    number_right = 0
    for i in range(number_test):
        if predict[i] == testLabelY[i]:
            number_right += 1
    accuracy = 1.0 * number_right/number_test
    print(accuracy)
