为了部落 来自艾泽拉斯勇士的python爬虫学习心得 爬取大众点评上的各种美食数据并进行数据分析
为了希尔瓦娜斯
- 第一个爬虫程序 csgo枪械数据
- 先上代码
- 基本思想
- 问题1
- 问题2
- 爬取大众点评
- URL分析
- 第一个难题
- 生成csv文件以及pandas库
- matplotlib.pyplot库
- K-Means聚类 散点图
- 便宜又好吃的推荐
第一个爬虫程序 csgo枪械数据
最开始的时候没想爬去大众点评,能对我这个博客有兴趣,应该对游戏也挺感兴趣,肯定知道csgo,csgo有很多第三方交易平台,我就想爬去igxe试一试,将上面csgo与所有道具的数据全部爬下来,在这也分享给大家。
先上代码
import requests
from lxml import html
import bs4
import os
#import urllib
#import re
#from bs4 import BeautifulSoup
#import urllib.request

def getHTMLText(url):
    print("url",url)
    try:
        r = requests.get(url,timeout = 30)
        r.raise_for_status()
        r.encoding = 'utf-8'
        return r.text
    except:
        return ""


def fillUnivlist(soup):
    datas = soup.find("div",{"class":"dataList"})
    allGunName(datas)


def allGunName(datas):
    TotalGun = datas.find_all('a')
    TotalGun_content = []
    for i in TotalGun:
        #print (i,i.text)
        print(i.text.replace('\n',''))
        TotalGun_content.append(i.text)
    #TotalGun_content = i.replace('\n','')
    #TotalGun_content = i.rstrip('\n')
    #print(TotalGun_content)
    #gun = datas.find("a",{"class":"single csgo"})
    #gunName = gun.find("div",{"class":"name"}).text
    #attion = gun.find("div",{"class":"price fl"}).text
    #number = gun.find("div",{"class":"sum fr"}).text
    #print(gunName)
    #print(attion)
    #print(number)

def getTotalpages(soup):
    datas = soup.find("div",{"class":"mod-pagination page"})
    Totalpages = datas.find_all('a')
    return Totalpages[-2].text


def getImg(soup):
    all_img = soup.find('div',class_='dataList').find_all('img')
    for img in all_img:
        src = img['src']
        img_url = 'https:'+ src   #static 格式是相对路径,需要通过图片找到它的绝对路径
        print(img_url)
        root = 'H:/IMG/'
        path = root + img_url.split('/')[-1]
        try:
            if not os.path.exists(root):
                os.mkdir(root)
            if not os.path.exists(path):
                r = requests.get(img_url)
                with open(path,'wb') as f:
                    f.write(r.content)
                    f.close()
                    print("文件保存成功")
            else:
                print("文件已存在")
        except:
            print("爬取失败")


def main():
    '''session_requests = requests.session()#session对象保存所有登陆会话的请求
    login_url = "https://www.igxe.cn/login/?path=/"
    result = session_requests.get(login_url)
    tree = html.fromstring(result.text)'''

    url_base = "https://www.igxe.cn/csgo/730"
    location = input("请输入你想搜索的道具: ")
    if not location:
        url = url_base
    else:
        url = url_base + '?type_name=' + location + '&is_buying=0&is_stattrak%5B%5D=0&is_stattrak%5B%5D=0&sort=2&ctg_id=0&type_id=27'
    html = getHTMLText(url)
    soup = bs4.BeautifulSoup(html,"html.parser")
    pages = getTotalpages(soup)
    print("共查询出{}页".format(pages))
    getImg(soup)

    fillUnivlist(soup)

main()
基本思想
igxe根本没有任何反爬虫机制,爬取比较轻松简单,第一次写的程序,代码会比较混乱,第一个程序我只做了爬去枪械的剩余数量,价格以及对应的枪械图片。第一个程序不详细讲解,分享两个在写程序过程中遇到并且大家以后可能会遇到的问题。
问题1

可能这个问题比较弱智,在获取每种道具的总页数时,第一次写爬虫,受到固定思维的限制,总想直接获取总页数12,但是不管是通过a标签中的page_no,href,class都不能得到12,因为每种枪械的数量不一样,不同枪械的对应的page_no也不一样,最后在室友的提醒下,当find_all(a).text时得到的是一个数组,这样就能得到枪械总共的页数。
问题2

在获取枪械图片时,在代码中得到的图片链接是src="//static.igxe.cn/steam/image/730/cd2ce6e53391d34823211e2154f8e2de.png"
通过这个链接是不能下载图片的,必须在前面加上https:,正确下载图片的img_url应该是’https:’+ src。
爬取大众点评
大众点评可能是被爬虫攻击的太多,现在的反爬虫机制可以用恶心至极来形容。
URL分析
大众点评url分析还是比较轻松
http://www.dianping.com/chengdu/ch10/g110r37o3
比如这个url对应的是成都青羊区所有的火锅,通过分析,可以得到g110对应的是火锅,r37对应的是青羊区,o3对应的是按照好评优先进行排序,分析过后发现这样基本可以通过大众点评了解道全国各地所有的美食,
并且大众每一种美食得出的数据都是50页,更方便爬取。
第一个难题

大众点评被爬虫攻击太多次,反爬虫机制特别成熟,很多数据根本找不到,比如图片中,我在页面中选中的是9,但是对应的代码中是class=“ack4g”,根本就不是9,所有数字对应的仅仅是一个class,在json中也找不到对应的数据,最终我使用了最笨办法,吧所有数字对应的class列出来,爬取class的名称,在最终进行替换。
num = {'hs-OEEp': 0, 'hs-4Enz': 2, 'hs-GOYR': 3, 'hs-61V1': 4, 'hs-SzzZ': 5, 'hs-VYVW': 6, 'hs-tQlR': 7, 'hs-LNui': 8, 'hs-42CK': 9}
生成csv文件以及pandas库
爬取下来的数据特别多,方便数据分析,存储为csv文件。pandas 是基于NumPy 的一种工具,该工具是为了解决数据分析任务而创建的。pandas提供了大量能使我们快速便捷地处理数据的函数和方法。
store = {'name': name, 'url': url, 'star': star, 'comment': comment, 'avg_price': avg_price, 'taste': taste, 'environment': environment, 'services': services, 'recommend': recommend}
store = pd.DataFrame(shop, columns=['name', 'url', 'star', 'comment', 'avg_price','taste', 'environment', 'services', 'recommend'])
store.to_csv("store.csv",encoding="utf_8_sig",index = False)
matplotlib.pyplot库
matplotlib.pyplot是一个有命令风格的函数集合,它看起来和MATLAB很相似。每一个pyplot函数都使一副图像做出些许改变,例如创建一幅图,在图中创建一个绘图区域,在绘图区域中添加一条线等等。在matplotlib.pyplot中,各种状态通过函数调用保存起来,以便于可以随时跟踪像当前图像和绘图区域这样的东西。绘图函数是直接作用于当前axes(matplotlib中的专有名词,图形中组成部分,不是数学中的坐标系。)通过matplotlib.pyplot库可以将数据可视化,以下对大众点评数据进行数据可视化的代码及一部分图片。
#星级情况
plt.figure(figsize=(15,10))
plt.title("星级情况")
sns.countplot(data["star"],order = ['五星商户','准五星商户','四星商户','准四星商户','三星商户'])
plt.show()

#评论数情况
plt.figure(figsize=(15,10))
plt.title("评论数情况")
sns.distplot(data["comment"],kde=True,rug=True,color='g')
plt.show()

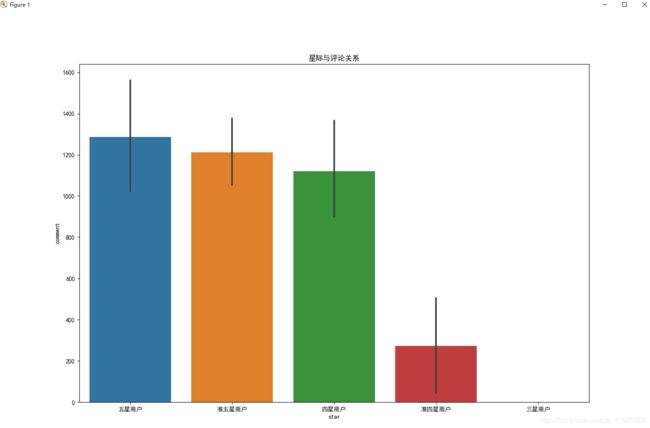
#星级和评论的关系
plt.figure(figsize=(15,10))
plt.title("星际与评论关系")
sns.barplot(data["star"],y=data["comment"],order = ['五星商户','准五星商户','四星商户','准四星商户','三星商户'])
plt.show()

#平均价格
plt.figure(figsize=(15,10))
plt.title("平均价格")
sns.distplot(data["avg_price"],kde=True,rug=True,color='m')
plt.show()

#价格和星级
plt.figure(figsize=(15,10))
plt.title("价格和星级")
sns.violinplot(data["star"],y=data["avg_price"],palette="Set2",order = ['五星商户','准五星商户','四星商户','准四星商户','三星商户'])
plt.show()

#价格和评论数量
plt.figure(figsize=(15,15))
plt.title("价格和评论数量")
sns.jointplot(data["avg_price"], data["comment"], kind="hex")
plt.show()

#口味,环境,服务得分分布情况
fig, axes = plt.subplots(3,1,figsize=(10, 30))
plt.title("口味 环境 服务得分分布情况")
sns.distplot(data['taste'], ax = axes[0],color = 'r', kde = True)
sns.distplot(data['environment'], ax = axes[1], color = 'y', kde=True)
sns.distplot(data['services'], ax = axes[2], color = 'g', kde=True)
plt.show()


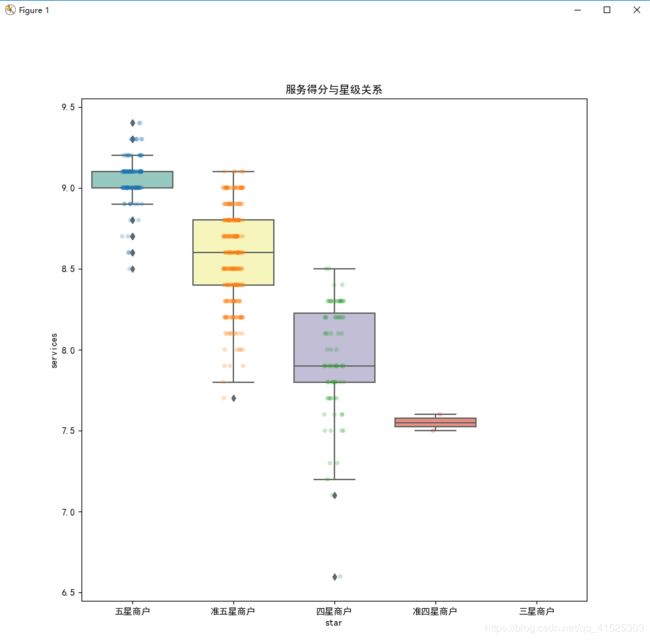
#口味,环境,服务得分与星级的关系
plt.figure(figsize=(10,10))
plt.title("口味得分与星级关系")
sns.boxplot(data["star"],data["taste"],order = ['五星商户','准五星商户','四星商户','准四星商户','三星商户'],palette="Set3")
sns.stripplot(x="star", y="taste", data=data, color='y',alpha=".25",order = ['五星商户','准五星商户','四星商户','准四星商户','三星商户'])
plt.show()

plt.figure(figsize=(10,10))
plt.title("环境得分与星级关系")
sns.boxplot(data["star"],data["environment"],order = ['五星商户','准五星商户','四星商户','准四星商户','三星商户'],palette="Set3")
sns.stripplot(x="star", y="environment", data=data, color='r',alpha=".25",order = ['五星商户','准五星商户','四星商户','准四星商户','三星商户'])
plt.show()

plt.figure(figsize=(10,10))
plt.title("服务得分与星级关系")
sns.boxplot(data["star"],data["services"],order = ['五星商户','准五星商户','四星商户','准四星商户','三星商户'],palette="Set3")
sns.stripplot(x="star", y="services", data=data, alpha=".25",order = ['五星商户','准五星商户','四星商户','准四星商户','三星商户'])
plt.show()

#口味,环境,服务得分与评论数量,平均价格的关系
plt.figure(figsize=(18,18))
plt.title("口味 环境 服务得分与评论数量和平均价格的关系")
df = data[['star','comment', 'avg_price','taste', 'environment', 'services']]
sns.pairplot(df,hue='star',palette="husl")
plt.show()

#口味,环境,服务
plt.figure(figsize=(15,15))
plt.title("口味 环境 服务")
df = data[['star','taste', 'environment', 'services']]
sns.pairplot(df,hue='star',palette="Set2",kind="reg")
plt.show()
K-Means聚类 散点图
其实我也没明白K-Means聚类算法的真的意义,这个是因为在别的博客上,看见别的大佬用这个去画散点图,通过散点图能够清晰的看到不同的类对应之间的关系,比如在我爬取的数据中,口味评分,服务评分以及平均消费时三个不同的类,通过聚类图清楚的反应三个不同类之间对应的关系。
estimator = KMeans(n_clusters=3)#构造聚类器
data_1 = data[['star_score','taste', 'environment', 'services']]
estimator.fit(data_1)#聚类
label_pred = estimator.labels_ #获取聚类标签
centroids = estimator.cluster_centers_ #获取聚类中心
inertia = estimator.inertia_ # 获取聚类准则的总和
便宜又好吃的推荐
其实最先是没有这个功能的,但是在做完数据分析后,觉得既然都有这么多店铺数据,何不尝试一下能不能根据自己想吃的餐饮类型,想吃的菜,能接受的消费金额,进行店铺推荐,并且每次与女朋友出去,问我最多的就是吃什么,找不到她喜欢吃的我可就难受了,有了这个功能,不管在任何地方,都能根据她的需求进行搜索,我可真是一个添狗。其实在具体实现时,发现其实也挺简单,无非就是多做几次判断。
comment_low = int(input('评论数量下限:'))
comment_high = int(input('评论数量上限:'))
avg_price_low = int(input('人均消费下限:'))
avg_price_hign = int(input('人均消费上限:'))
special_dish = input('想吃的特色菜:')

tj = tuijian[(tuijian['comment']>comment_low)&(tuijian['comment']<comment_high) & (tuijian['avg_price']>avg_price_low)& (tuijian['avg_price']<avg_price_hign)].reset_index()
for i in range(len(tj)):
    if special_dish in tj['recommend'][i]:
        print(tj['name'][i])


