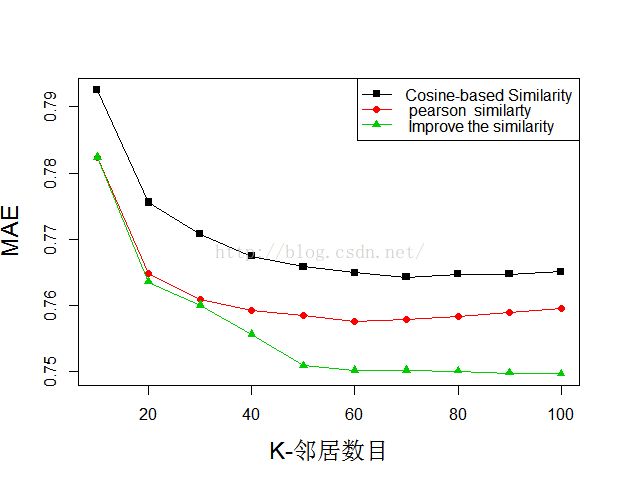
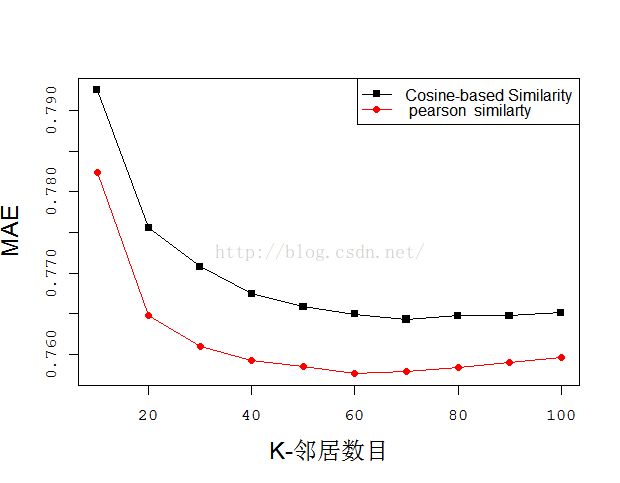
a=read.table("C:\\Users\\Administrator\\Desktop\\data.txt",head= T)
k<-c(10,20,30,40,50,60,70,80,90,100)
matplot(k,a,type ="o",pch=15:18,lty =1,bg = "yellow",lwd=1,xlab = "K-邻居数目" ,ylab = "MAE",font = 1,font.lab =1,cex.lab =1.5)
#lwd代表线条粗细x=c(a$row.names)
#xlab, ylab表示x轴y轴标题,xlim, ylim表示x轴和y轴的范围,lty表示连线的类型,pch表#示绘图符号。font.lab表示坐标轴签字字体。font表示文字字体,type ="o"制定图形类型
legend("topright",pch=15:18,lty=1,merge=T,legend=c("Cosine-based Similarity"," pearson  similarty "," Improve the similarity"),col=1:3)
#legend=c("1 ","2 ","3 ")选择变量名称,添加图例

a=read.table("C:\\Users\\Administrator\\Desktop\\data2.txt",head= T)

matplot(k,a,type ="o",pch=15:18,lty =1,bg = "yellow",lwd=1,xlab = "K-邻居数目" , ylab = "MAE",font = 10,font.lab =1,cex.lab =1.5)#lwd代表线条粗细
#xlab, ylab表示x轴y轴标题,xlim, ylim表示x轴和y轴的范围,lty表示控制连线的类型,#pch表示绘图符号。font.lab表示坐标轴签字字体。font表示文字字体,
legend("topright",pch=15:18,lty=1,merge=T,legend=c("Cosine-based Similarity"," pearson  similarty "),col=1:2)
#legend=c("1 ","2 ","3 ")选择变量名称,添加图例


