基于Logistic回归的上市公司ROE预测
基于Logistic回归的上市公司ROE预测
目录
- 基于Logistic回归的上市公司ROE预测
- 前言
- 基于Logistic回归的上市公司ROE预测
- 导入相关库
- 读取并查看数据基本情况
- 划分自变量与因变量
- 查看数据相关性
- 计算相关矩阵
- 绘制相关性热力图
- Logistic回归模型的建立
- 类别赋权
- 划分训练集和测试集
- 数据标准化
- 模型建立
- 模型测试
- 绘制模型的ROC曲线
- 降采样
- 查看数据原始情况
- 数据降采样
- 查看降采样后的数据情况
- 设置自变量与因变量
- 划分训练集和测试集
- 数据标准化
- 模型建立
- 模型测试
- 绘制模型的ROC曲线
- 后记
- K折交叉验证
- 重采样
前言
当数据集的响应变量(因变量)不再是连续值,而是分类型(或者叫离散型)数据时,经典线性模型(要求响应变量必须是连续型变量)则不适用了。而有一类模型,拓展了经典线性模型的应用条件,使其应用范围更加广泛,这类模型就是:广义线性模型。
广义线性模型要求响应变量服从指数族分布(常见的正态分布、泊松分布、伯努利分布、伽马分布等等都属于这种分布),并通过一个非线性连接函数将响应变量与自变量的线性组合连接起来。常见的广义线性模型如:泊松回归模型、Logistic回归模型、Probit回归模型等等。
当响应变量为二分类变量时,首先会想到大名鼎鼎的Logistic回归模型了!因此本文将通过一个案例介绍Logistic回归模型的应用!
同时,本文案例数据存在样本比例不平衡问题,将介绍两个常见的解决办法。
基于Logistic回归的上市公司ROE预测
ROE,英文全称为Return on Equity,净资产收益率,是企业净利润与净资产的比值,可以较好地反映企业盈利能力。股神巴菲特曾经说过“如果非要我用一个指标进行选股,我会选择ROE,那些ROE能常年持续稳定在20%以上的公司都是好公司,投资者应当考虑买入”。
毕竟ROE能够保持在20%以上的公司只有少数!
本文案例目的是根据上市公司当年的财务数据预测下一年的ROE能否大于10%(响应变量,数值为0和1)。
数据指标如下:
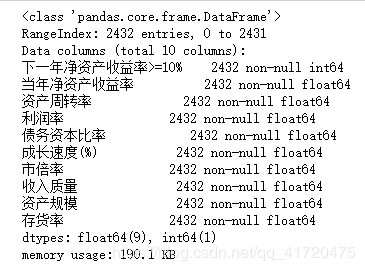
- 下一年净资产收益率>=10%(01变量,1表示大于等于10%,0表示小于10%)
- 当年净资产收益率
- 资产周转率
- 利润率
- 债务资本比率
- 成长速度(%)
- 市倍率
- 收入质量
- 资产规模
- 存货率
具体指标含义这里不详细展开。
(本文数据来源于网络)
导入相关库
import pandas as pd
import matplotlib.pyplot as plt
import seaborn as sns
读取并查看数据基本情况
data = pd.read_csv('ROE_predict.csv',encoding = 'gbk')#数据表涉及中文字符需设置支持中文字符
data.head()
#查看数据维度
data.shape
输出:
(2432, 10)
以上输出可以看出数据共10个指标、2432条记录。
data.info()
划分自变量与因变量
y = data.iloc[:,0]
x = data.iloc[:,1:]

#查看样本比例
y.sum()
输出:
158
根据结果可以看出:
- 因变量y中正例数量只有158,负例数量为2432-158 = 2274,样本比例严重不平衡;
- 后续建模时需要对样本不均衡问题进行处理,以免影响模型的预测结果。
查看数据相关性
在使用logistic回归模型时,需要对数据进行多重共线性检验。
- 多重共线性是指回归模型中的解释变量之间由于存在精确相关关系或高度相关关系而使模型估计失真或难以估计准确。
- 一般可以通过计算各指标的方差膨胀因子(VIF)进行检验。本文直接查看自变量之间是否存在高度相关关系进行判断。
计算相关矩阵
corr = data.corr(method = 'pearson')
绘制相关性热力图
plt.subplots(figsize=(8,8)) #设置画面大小
plt.rcParams['font.sans-serif'] = ['SimHei']  # 解决中文显示问题-设置字体为黑体
# plt.rcParams['axes.unicode_minus'] = False  # 解决保存图像是负号'-'显示为方块的问题
sns.heatmap(corr,annot=True,vmax=1,square=True,cmap="Reds")
plt.title('相关性热力图')
plt.show()
输出:
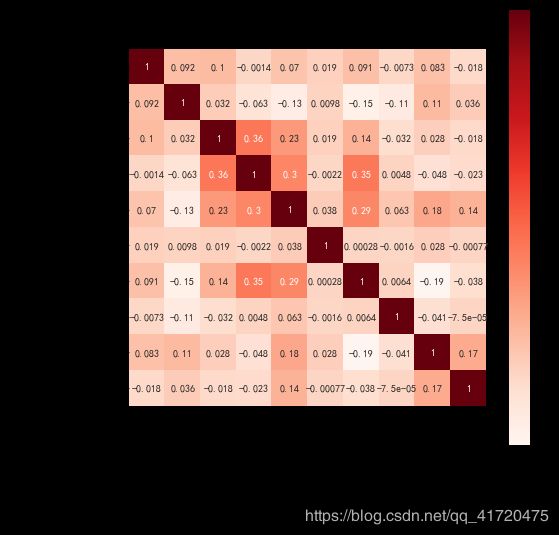
从相关性热力图可以看出,变量之间的相关关系均小于0.5,故不存在多重共线性问题。
Logistic回归模型的建立
在对以上数据进行建模时,需要考虑到数据比例不平衡问题,常用的解决办法有对数据类别赋权、进行重采样、降采样。
本文将采用两种解决办法进行实践:
- 类别赋权
- 降采样
类别赋权
根据样本比例对数据进行加权计算来解决样本比例不平衡问题。
划分训练集和测试集
#数据集划分
from sklearn.model_selection import train_test_split
x_train,x_test,y_train,y_test = train_test_split(x,y,test_size = 0.3,random_state = 0)
数据标准化
#数据标准化
from sklearn.preprocessing import StandardScaler
sc_x = StandardScaler()
x_train = sc_x.fit_transform(x_train)
x_test = sc_x.transform(x_test)
通过数据标准化消除量纲影响。
模型建立
from sklearn.linear_model import LogisticRegression as LR
lr = LR(class_weight='balanced') #进行类别加权
lr.fit(x_train,y_train)
输出:
LogisticRegression(C=1.0, class_weight=‘balanced’, dual=False,
fit_intercept=True, intercept_scaling=1, l1_ratio=None,
max_iter=100, multi_class=‘auto’, n_jobs=None, penalty=‘l2’,
random_state=None, solver=‘lbfgs’, tol=0.0001, verbose=0,
warm_start=False)
sklearn中logistic函数里面有一个class_weight的参数,顾名思义就是类别权重,可以有两种设置方法:
- 自定义权重class_weight={类别1 : 权重1 , 类别2 : 权重2…},例如:
class_weight={1 : 0.8 , 0 : 0.2}表示对类别为1的权重赋为0.8,类别为0的权重赋为0.2(具体权值根据类别的比例进行设置)。 - 设置为
balanced,则模型会根据训练数据的样本量来计算权重。某种类型样本量越多,则权重越低,样本量越少,则权重越高,从而解决样本不平衡问题。
本文选择 “balanced”
#模型在训练集上的预测正确率
print(lr.score(x_train,y_train))
输出:
0.763219741480611
#输出模型系数和截距
coef = lr.coef_
intercept = lr.intercept_
print('coef is:',coef)
print('intercept is:',intercept)
输出:
coef is: [[ 0.68576679 0.2016142 -0.55098854 0.23870546 0.06905926 0.96612352
0.07003544 0.37511019 -0.12486432]]
intercept is: [-0.29483068]
(这里回归系数比较多,就不写出模型的具体形式了)
模型测试
#测试
y_pred = lr.predict(x_test)
print(lr.score(x_test,y_test))
输出:
0.7602739726027398
结果说明在训练集和测试集上的正确率均在75%以上。
#查看分类报告
from sklearn.metrics import classification_report
print(classification_report(y_test, y_pred))
输出:
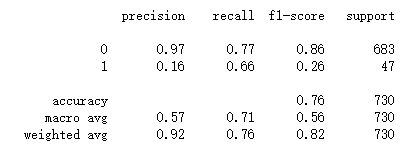
输出结果中,模型关于1的的精确率(precision)只有0.16,这是因为数据集中1的样例数量太少,模型关于类别为1的样本特征学习不足,因此采用加权解决样本类别不平衡的方法不理想啊。
绘制模型的ROC曲线
#绘制ROC曲线
y_score = lr.predict_proba(x_test)[:,1]
fpr,tpr,threshold = metrics.roc_curve(y_test,y_score)
roc_auc = metrics.auc(fpr,tpr)

plt.plot(fpr,tpr,alpha = 0.5)
# plt.stackplot(fpr,tpr,color = '',alpha = 0.5,edgecolor = 'black')
plt.plot(fpr,tpr,color='black',lw = 1)

plt.plot([0,1],[0,1],color = 'red',linestyle = '--')

# plt.text(0.5,0.3,'ROC curve (area = %0.2f)'%roc_auc)
plt.title("ROC curve of %s (AUC = %.4f)" % ('Logistic',roc_auc))
plt.xlabel('True Positive Rate')
plt.ylabel('False Positive Rate')

plt.show()
输出:
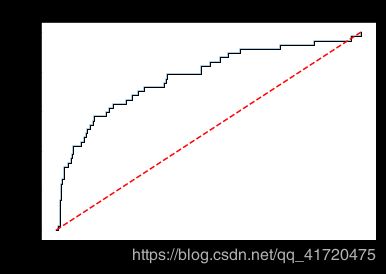
ROC曲线下面积AUC为0.7758,表现还算可以。
降采样
这里我们采用降采样来解决样本比例不平衡的问题,看看模型结果。
查看数据原始情况
from imblearn.under_sampling import RandomUnderSampler  # 欠抽样处理库RandomUnderSampler
groupby_data_orgian = data.groupby('下一年净资产收益率>=10%').count()
print(groupby_data_orgian)
数据降采样
model_RandomUnderSampler = RandomUnderSampler() #创建RandomUnderSampler模型对象
x_rus,y_rus = model_RandomUnderSampler.fit_sample(x,y)
查看降采样后的数据情况
RandomUnderSampler_resampled = pd.concat([x_rus, y_rus],axis=1)
groupby_data_RandomUnderSampler = RandomUnderSampler_resampled.groupby('下一年净资产收益率>=10%').count()
print(groupby_data_RandomUnderSampler)
输出:

通过匹配样本为1的数量,随机采样样本为0的等同数量。
设置自变量与因变量
rus_data = RandomUnderSampler_resampled
y = rus_data.iloc[:,9]
x = rus_data.iloc[:,:9]
划分训练集和测试集
#数据集划分
from sklearn.model_selection import train_test_split
x_train,x_test,y_train,y_test = train_test_split(x,y,test_size = 0.3,random_state = 0)
数据标准化
#数据标准化
from sklearn.preprocessing import StandardScaler
sc_x = StandardScaler()
x_train = sc_x.fit_transform(x_train)
x_test = sc_x.transform(x_test)
模型建立
from sklearn.linear_model import LogisticRegression as LR
lr = LR() #无设置分类权重
lr.fit(x_train,y_train)
输出:
LogisticRegression(C=1.0, class_weight=None, dual=False, fit_intercept=True,
intercept_scaling=1, l1_ratio=None, max_iter=100,
multi_class=‘auto’, n_jobs=None, penalty=‘l2’,
random_state=None, solver=‘lbfgs’, tol=0.0001, verbose=0,
warm_start=False)
#模型在训练集上的预测正确率
print(lr.score(x_train,y_train))
输出:
0.7828054298642534
coef = lr.coef_
intercept = lr.intercept_
print('coef is:',coef)
print('intercept is:',intercept)
输出:
coef is: [[ 0.16259781 0.56575651 2.15861084 0.62374577 0.90740003 1.32271559
-0.41722118 0.3419475 -0.07676475]]
intercept is: [0.42730463]
模型测试
#测试
y_pred = lr.predict(x_test)
print(lr.score(x_test,y_test))
输出:
0.8210526315789474
#查看分类报告
from sklearn.metrics import classification_report
print(classification_report(y_test, y_pred))
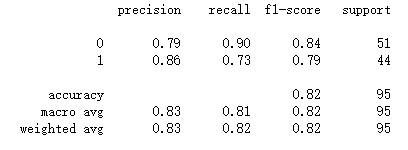
可以看出模型的精确度(precision)表现较优了!(因为降采样后数据的样本比例为1:1)
绘制模型的ROC曲线
#绘制ROC曲线
y_score = lr.predict_proba(x_test)[:,1]
fpr,tpr,threshold = metrics.roc_curve(y_test,y_score)
roc_auc = metrics.auc(fpr,tpr)

plt.plot(fpr,tpr,alpha = 0.5)
# plt.stackplot(fpr,tpr,color = '',alpha = 0.5,edgecolor = 'black')
plt.plot(fpr,tpr,color='black',lw = 1)

plt.plot([0,1],[0,1],color = 'red',linestyle = '--')

# plt.text(0.5,0.3,'ROC curve (area = %0.2f)'%roc_auc)
plt.title("ROC curve of %s (AUC = %.4f)" % ('Logistic',roc_auc))
plt.xlabel('True Positive Rate')
plt.ylabel('False Positive Rate')
输出:
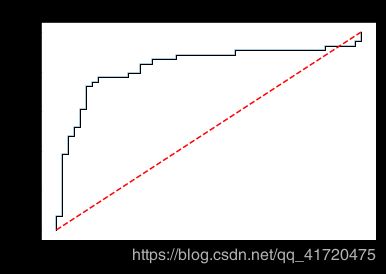
ROC曲线下面积AUC为0.8284,表现比类别加权更优!
后记
对数据进行降采样后,其实是损失了一定的样本数据,因为降采样是在样本数量较多的类别中抽取与类别较少的相同数量样本,其结果也具有一定的随机性(运行多次结果可能不相等),因此降采样的数据量会大大减少。而对于数据量少的样本,如果将数据划分为训练集和测试集,模型用于训练的数据就更少了,结果具有一定的随机性。因此为了充分利用数据,可以考虑采用交叉验证来查看模型的预测正确率。
K折交叉验证
k折交叉验证,即将数据集划分为k等份,利用K-1份数据用于训练,剩下的一份用于测试模型,因此模型可以训练k次,取k次结果的均值。
#10折交叉验证
from sklearn.model_selection import cross_val_score
cross_val_score(lr,x,y,cv=10,scoring='accuracy').mean()
输出:
0.7692540322580645
k折交叉验证的好处在于可以充分利用了数据,使所有数据得到了训练学习,返回一个比较稳定的结果,一般用于模型选择或者模型参数选择。
重采样
与降采样相反,重采样是增加样本量较少的类别数据,从而解决样本比例不平衡问题,这里就不具体展开了,感兴趣的读者可以自行了解。
(本文数据来源于网络)

