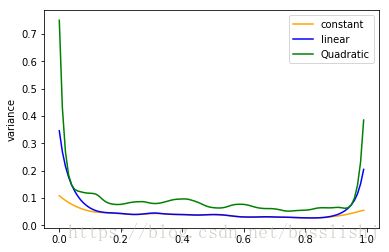
The Elements of Statistical Learning 第六章figure6-6 python绘图
#生成0-1均匀分布的随机数
import numpy as np#调用numpy库,目的是使用矩阵,对数据矩阵进行操作
import matplotlib.pyplot as plt#调用matplotlib中的函数pyplot,为画图做准备
np.random.seed(12345)
uni_data=np.random.uniform(0,1,size=(100,1))
#在已知function构造相应的response value
values=np.sin(4*uni_data)+np.random.normal(0,1/3,size=(100,1))
import numpy as np#调用numpy库,目的是使用矩阵,对数据矩阵进行操作
import matplotlib.pyplot as plt#调用matplotlib中的函数pyplot,为画图做准备
np.random.seed(12345)
uni_data=np.random.uniform(0,1,size=(100,1))
#在已知function构造相应的response value
values=np.sin(4*uni_data)+np.random.normal(0,1/3,size=(100,1))
input_x=np.arange(0,1,0.01)
#所需参数设置
onearray=np.ones((100,1))
uni_data2=uni_data**2
B=np.hstack((onearray,uni_data))#regression matrix
C=np.hstack((B,uni_data2))
#所需参数设置
onearray=np.ones((100,1))
uni_data2=uni_data**2
B=np.hstack((onearray,uni_data))#regression matrix
C=np.hstack((B,uni_data2))
#计算常量等价核
def getConstantEquivalentKernel(x0,lamb):
K=np.zeros((1,100))
for i in np.arange(100):
if abs((uni_data[i,]-x0)/lamb)>1:
K[0,i]=0
else:
K[0,i]=(1-abs((uni_data[i,]-x0)/lamb)**3)**3
sumK=np.sum(K)
l=K/sumK
return l
constantvalues=np.zeros((100,100))
for i in np.arange(100):
constantvalues[i,:]=getConstantEquivalentKernel(input_x[i],0.2).reshape(1,100)
constantVariance=np.sum(constantvalues**2,axis=1)
plt.plot(input_x,constantVariance,c="orange",label="constant")
#计算线性的等价核
def getLinearEquivalentKernel(x0,lamb):
#设置kernel diagonal matrix
b=np.array((1,x0))
zeroarray=np.zeros((100,100))
for i in np.arange(100):
if abs((uni_data[i,]-x0)/lamb)>1:
zeroarray[i,i]=0
else:
zeroarray[i,i]=(1-abs((uni_data[i,]-x0)/lamb)**3)**3
#设置一堆虚拟参数,方便表示
m=np.linalg.inv(B.T.dot(zeroarray).dot(B))
f=b.dot(m).dot(B.T).dot(zeroarray)
return f
allvalues=np.zeros((100,100))
for i in np.arange(100):
allvalues[i,:]=getLinearEquivalentKernel(input_x[i],0.2).reshape(1,100)
linerVariance=np.sum(allvalues**2,axis=1)
plt.plot(input_x,linerVariance,c="blue",label="linear")
allvalues[i,:]=getLinearEquivalentKernel(input_x[i],0.2).reshape(1,100)
linerVariance=np.sum(allvalues**2,axis=1)
plt.plot(input_x,linerVariance,c="blue",label="linear")
#计算二次的等价核
def getQuadraticEquivalentKernel(x0,lamb):
b=np.array((1,x0,x0**2))
zerosarray=np.zeros((100,100))
for i in np.arange(100):
if abs((uni_data[i,]-x0)/lamb)>1:
zerosarray[i,i]=0
else:
zerosarray[i,i]=(1-abs((uni_data[i,]-x0)/lamb)**3)**3
#设置一些局部参数方便表示
m=np.linalg.inv(C.T.dot(zerosarray).dot(C))
f=b.dot(m).dot(C.T).dot(zerosarray)
return f
newvalues=np.zeros((100,100))
for i in np.arange(100):
newvalues[i,:]=getQuadraticEquivalentKernel(input_x[i],0.2).reshape(1,100)
QuadraticVariance=np.sum(newvalues**2,axis=1)
plt.plot(input_x,QuadraticVariance,c="green",label="Quadratic")
plt.legend(loc="best")
plt.ylabel("variance")
plt.show()
newvalues[i,:]=getQuadraticEquivalentKernel(input_x[i],0.2).reshape(1,100)
QuadraticVariance=np.sum(newvalues**2,axis=1)
plt.plot(input_x,QuadraticVariance,c="green",label="Quadratic")
plt.legend(loc="best")
plt.ylabel("variance")
plt.show()
图形如下
