ggplot2-高维可视化图表
ggplot2-高维可视化图表
沈益
8/18/2019
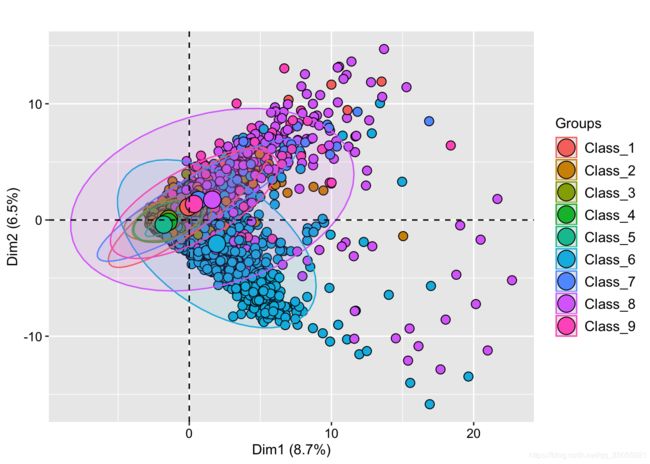
PCA
set.seed(1)
num_rows_sample <- 5000

train        <- read.csv("配套资源/第8章 高维数据型图表/Tsne_Data.csv")
train_sample <- train[sample(1:nrow(train), size = num_rows_sample),]
features     <- train_sample[,c(-1, -95)]
features.pca<- PCA(features, graph = FALSE)

fviz_pca_ind(features.pca,
             geom.ind = "point", # show points only (nbut not "text")
             pointsize =3,pointshape = 21,fill.ind = train_sample$target, # color by groups
             #palette = c("#00AFBB", "#E7B800", "#FC4E07"),
             addEllipses = TRUE, # Concentration ellipses
             legend.title = "Groups",
             title="")+
  theme_grey() +
  theme(
    text=element_text(size=12,face="plain",color="black"),
    axis.title=element_text(size=11,face="plain",color="black"),
    axis.text = element_text(size=10,face="plain",color="black"),
    legend.title = element_text(size=11,face="plain",color="black"),
    legend.text = element_text(size=11,face="plain",color="black"),
    legend.background = element_blank(),
    legend.position="right"
  )
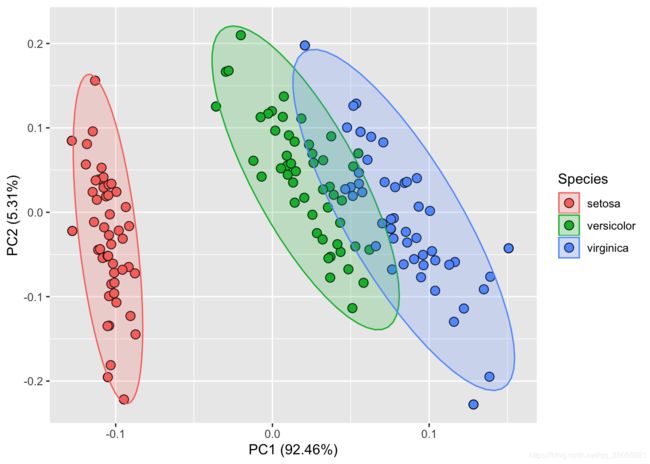
library(ggfortify)
autoplot(prcomp(df), data = iris,
shape=21,colour ="black",fill= 'Species', size=3,
frame = TRUE,frame.type = 'norm', frame.colour = 'Species')t-SNE
library(Rtsne) # Load package
library(ggplot2)
library(RColorBrewer)

iris_unique <- unique(iris) # Remove duplicates
set.seed(42) # Sets seed for reproducibility
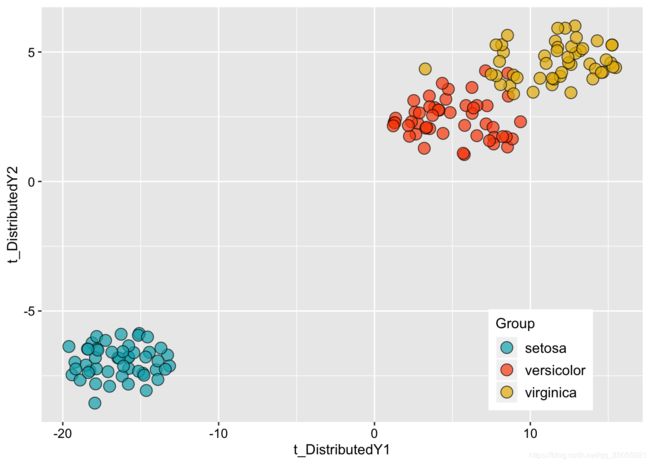
tsne_out <- Rtsne(as.matrix(iris_unique[,1:4])) # Run TSNE

mydata<-data.frame(tsne_out$Y,iris_unique$Species)
colnames(mydata)<-c("t_DistributedY1","t_DistributedY2","Group")

ggplot(data=mydata,aes(t_DistributedY1,t_DistributedY2,fill=Group))+
  geom_point(size=4,colour="black",alpha=0.7,shape=21)+
  scale_fill_manual(values=c("#00AFBB",  "#FC4E07","#E7B800","#2E9FDF"))+
  theme(
    text=element_text(size=12,face="plain",color="black"),
    axis.title=element_text(size=11,face="plain",color="black"),
    axis.text = element_text(size=10,face="plain",color="black"),
    legend.title = element_text(size=11,face="plain",color="black"),
    legend.text = element_text(size=11,face="plain",color="black"),
    legend.position=c(0.83,0.15)
  )
set.seed(1)
num_rows_sample <- 5000
train <- read.csv("配套资源/第8章 高维数据型图表/Tsne_Data.csv")
train_sample <- train[sample(1:nrow(train), size = num_rows_sample),]
features <- train_sample[,c(-1, -95)]
tsne <- Rtsne(as.matrix(features), check_duplicates = FALSE, pca = TRUE,
perplexity=30, theta=0.5, dims=2)
embedding <- as.data.frame(tsne$Y)
embedding$Class<-train_sample$target
ggplot(embedding, aes(x=V1, y=V2, color=Class)) +
geom_point(size=1.25) +
#scale_colour_manual(values=palette(brewer.pal(8,"Set1")))
guides(colour = guide_legend(override.aes = list(size=4))) +
xlab("t_DistributedY1") + ylab("t_DistributedY2") +
#ggtitle("t-SNE 2D Embedding of Products Data") +
#theme_light(base_size=20) +
theme(strip.background = element_blank(),
strip.text.x = element_blank(),
#axis.text.x = element_blank(),
#axis.text.y = element_blank(),
#axis.ticks = element_blank(),
axis.line = element_blank(),
panel.border = element_blank())分面图
library(ggplot2)
#library(scatterplot3d)
library(scales)
library(wesanderson)
library(RColorBrewer)
library(dplyr)
library(grid)
Alz<-read.csv("配套资源/第8章 高维数据型图表/Facet_Data.csv", header = T)
df<-Alz[,c("Class","SOD","tau","age")]
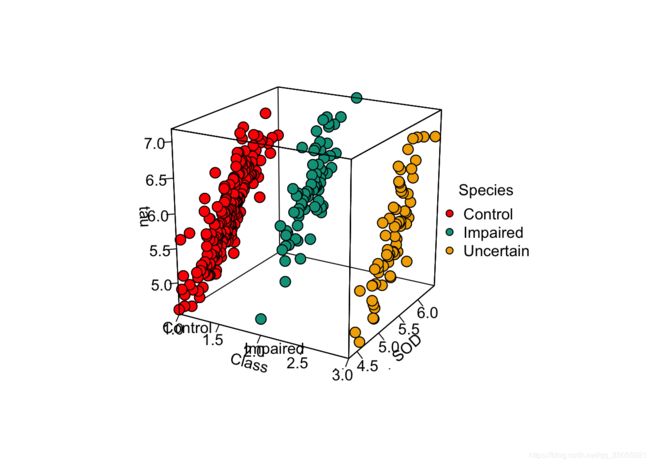
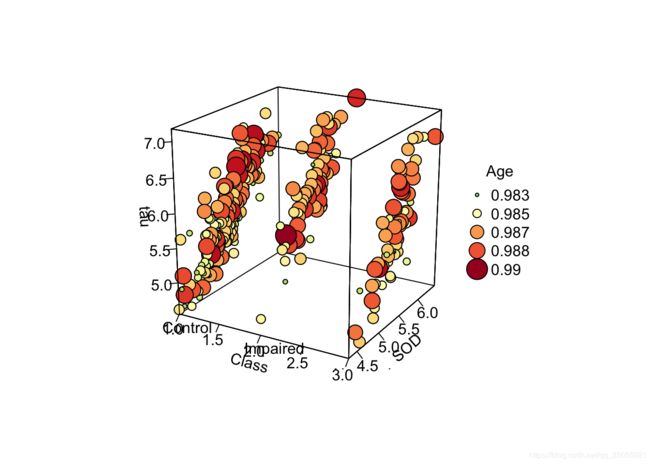
library(plot3D)
colors0 <- wes_palette(n=3, name="Darjeeling1")
df$Class_x<-as.numeric(df$Class)
colors <- colors0[df$Class_x]
pmar <- par(mar = c(5.1, 4.1, 4.1, 6.1))
with(df, scatter3D(x = Class_x, y = SOD, z = tau, #bgvar = mag,
pch = 21, cex = 1.5,col="black",bg=colors,
xlab = "Class",
ylab = "SOD",
zlab = "tau",
labels=c(""),
ticktype = "detailed", bty = "f",box = TRUE,expand = 1,#cex.axis= 1e-09,
#panel.first = panelfirst,
theta = 30, phi = 20, d=5,
colkey = FALSE)#list(length = 0.5, width = 0.5, cex.clab = 0.75))
)
text3D(x = 1:3, y = rep(4, 3), z = rep(4.5, 3), labels = levels(df$Class),
add = TRUE, adj = 0, col = "black", bty = "g")
#colkey (col=colors0,clim=c(0,6),
# at = c(1, 3, 5), labels = levels(df$Class),
# clab = "Class", add=TRUE, width=1.5,length=0.2,side = 4)
legend("right",title = "Species",legend=levels(df$Class),pch=21,
cex=1,y.intersp=1,pt.bg = colors0,bg="white",bty="n")Alz<-read.csv("配套资源/第8章 高维数据型图表/Facet_Data.csv", header = T)
df<-Alz[,c("Class","SOD","tau","age")]
colors0 <- wes_palette(n=3, name="Darjeeling1")
df$Class_x<-as.numeric(df$Class)
colors <- colors0[df$Class_x]
pmar <- par(mar = c(5.1, 4.1, 4.1, 6.1))
with(df, scatter3D(x = Class_x, y = SOD, z = tau, #bgvar = mag,
pch = 21, cex = rescale(df$age, c(.5, 3)),col="black",bg=colors,
xlab = "Class",
ylab = "SOD",
zlab = "tau",
labels=c(""),
ticktype = "detailed", bty = "f",box = TRUE,expand = 1,#cex.axis= 1e-09,
#panel.first = panelfirst,
theta = 30, phi = 20, d=5,
colkey = FALSE)#list(length = 0.5, width = 0.5, cex.clab = 0.75))
)
text3D(x = 1:3, y = rep(4, 3), z = rep(4.5, 3), labels = levels(df$Class),
add = TRUE, adj = 0, col = "black", bty = "g")
legend("right",title = "Species",legend=levels(df$Class),pch=21,
cex=1,y.intersp=1,pt.bg = colors0,bg="white",bty="n")
N<-5
breaks<-round(seq(min(df$age),max(df$age),length.out=5),3)
legend("topright",title = "Age",legend=breaks,pch=21,
pt.cex=rescale(breaks, c(.5, 3)),y.intersp=1,
pt.bg = "white",bg="white",bty="n")colormap <- colorRampPalette(rev(brewer.pal(11,'RdYlGn')))(100)
index <- ceiling(((prc <- 0.7 * df$age/ diff(range(df$age))) - min(prc) + 0.3)*100)
for (i in seq(1,length(index)) ){
prc[i]=colormap[index[i]]
}
pmar <- par(mar = c(5.1, 4.1, 4.1, 6.1))
with(df, scatter3D(x = Class_x, y = SOD, z = tau, #bgvar = mag,
pch = 21, cex = rescale(df$age, c(.5, 3)),col="black",bg=prc,#colors,
xlab = "Class",
ylab = "SOD",
zlab = "tau",
labels=c(""),
ticktype = "detailed", bty = "f",box = TRUE,expand = 1,#cex.axis= 1e-09,
#panel.first = panelfirst,
theta = 30, phi = 20, d=5,
colkey = FALSE)#list(length = 0.5, width = 0.5, cex.clab = 0.75))
)
text3D(x = 1:3, y = rep(4, 3), z = rep(4.5, 3), labels = levels(df$Class),
add = TRUE, adj = 0, col = "black", bty = "g")
#colkey (col=colormap,clim=range(df$age),clab = "Age", add=TRUE, length=0.45,side = 4)
N<-5
breaks<-round(seq(min(df$age),max(df$age),length.out=5),3)
legend_index <- ceiling(((legend_prc <- 0.7 *breaks/ diff(range(breaks))) - min(legend_prc) + 0.3)*100)
for (i in seq(1,length(legend_index)) ){
if (legend_index[i]>100){
legend_index[i]<-100
}
legend_prc[i]=colormap[legend_index[i]]
}
legend("right",title = "Age",legend=breaks,pch=21,
pt.cex=rescale(breaks, c(.5, 3)),y.intersp=1,
pt.bg = legend_prc,bg="white",bty="n")library(ggplot2)
library(RColorBrewer)
library(reshape2)
library(wesanderson)
Alz <-read.csv("配套资源/第8章 高维数据型图表/Facet_Data.csv", header = T)
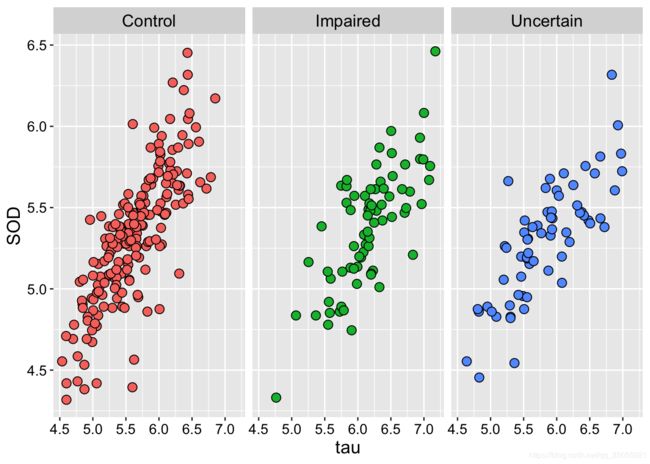
ggplot(Alz, aes(x = tau, y = SOD, fill = Class)) +
geom_point(size=3,shape=21,colour="black") +
# stat_smooth(method = "loess")+
facet_wrap( ~ Class) +
theme(
strip.text = element_text(size=13,face="plain",color="black"),
text=element_text(size=12,face="plain",color="black"),
axis.title=element_text(size=14,face="plain",color="black"),
axis.text = element_text(size=11,face="plain",color="black"),
legend.position="none"
)ggplot(Alz, aes(x = tau, y = SOD,colour=Class, fill = Class)) +
geom_point(size=2,shape=21,fill="black",colour="black",alpha=0.5) +
stat_smooth(method = "loess")+
facet_grid(. ~ Class) +
theme(
strip.text = element_text(size=13,face="plain",color="black"),
text=element_text(size=12,face="plain",color="black"),
axis.title=element_text(size=14,face="plain",color="black"),
axis.text = element_text(size=11,face="plain",color="black"),
legend.position="none"
)ggplot(Alz, aes(x = tau, y = SOD, fill= Class, size = age)) +
geom_point(shape=21,colour="black",alpha=0.7) +
facet_wrap( ~ Class)+
guides(fill = FALSE)+
theme(
strip.text = element_text(size=13,face="plain",color="black"),
text=element_text(size=12,face="plain",color="black"),
axis.title=element_text(size=14,face="plain",color="black"),
axis.text = element_text(size=11,face="plain",color="black"),
legend.position=c(0.935,0.13),
legend.background = element_rect(fill=alpha("white",0))
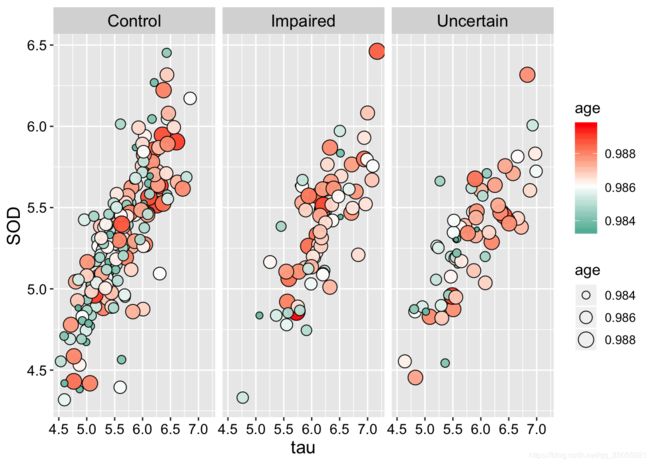
)ggplot(Alz, aes(x = tau, y = SOD, fill=age, size = age)) +
geom_point(shape=21,colour="black",alpha=0.95) +
scale_fill_gradient2(low="#00A08A",mid="white",high="#FF0000",midpoint = mean(Alz$age))+
facet_wrap( ~ Class)+
#guides(fill = FALSE)+
theme(
strip.text = element_text(size=13,face="plain",color="black"),
text=element_text(size=12,face="plain",color="black"),
axis.title=element_text(size=14,face="plain",color="black"),
axis.text = element_text(size=11,face="plain",color="black"),
#legend.position=c(0.935,0.13),
legend.background = element_rect(fill=alpha("white",0))
)Alz$male<-as.character(Alz$male)
Alz$male[Alz$male=="0"] <- "Female"
Alz$male[Alz$male=="1"] <- "Male"
colnames(Alz)[colnames(Alz)=="male"]<-"Gender"
ggplot(Alz, aes(x = tau, y = SOD, fill= Class, size = age)) +
geom_point(shape=21,colour="black",alpha=0.7) +
facet_grid(Gender ~ Class)+
guides(fill = FALSE)+
theme(
strip.text = element_text(size=13,face="plain",color="black"),
text=element_text(size=12,face="plain",color="black"),
axis.title=element_text(size=14,face="plain",color="black"),
axis.text = element_text(size=11,face="plain",color="black"),
legend.position=c(0.935,0.11),
legend.background = element_rect(fill=alpha("white",0))
)矩阵散点图
library(ggplot2)
library(GGally)
library(RColorBrewer)
#library(devtools)
#install_github("ggobi/ggally")
#-------------------------------图7-3-1 矩阵散点图(a)单数据系列 ----------------------------------------------
lowerFn <- function(data, mapping, method = "loess", ...) {
p <- ggplot(data = data, mapping = mapping) +
geom_point(size=1)+#colour = "blue") +
geom_smooth(method = method, color = "red", ...)+
theme(panel.background = element_rect(fill = "white", colour = "grey20"))
p
}
diagFn <- function(data, mapping, method = "loess", ...) {
p <- ggplot(data = data, mapping = mapping) +
geom_histogram(colour = "black",size=0.1)+#)
#geom_smooth(method = method, color = "red", ...)+
theme(panel.background = element_rect(fill = "white", colour = "grey20"))
p
}
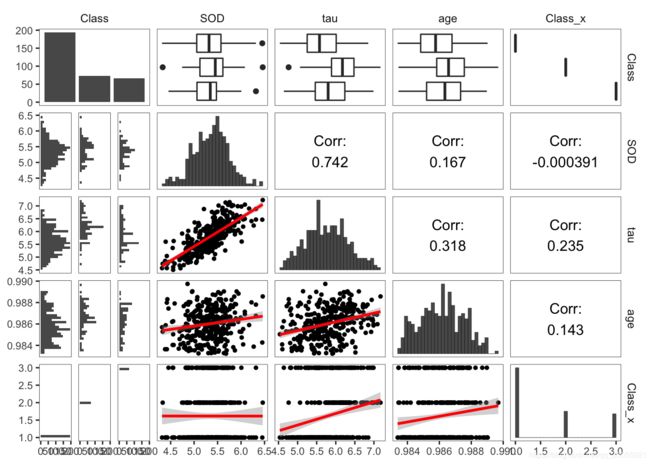
ggpairs(df,
lower = list(continuous = wrap(lowerFn, method = "lm")),
diag = list(continuous = wrap(diagFn)),#"barDiag", colour = "black")),
upper = list(continuous = wrap("cor", size = 4,color="black", alignPercent = 0.9)))+
theme_bw()+
theme(panel.grid.major = element_blank(),
panel.grid.minor = element_blank(),
panel.border = element_rect( colour = "black", fill = NA,size=0.25),
axis.title=element_text(size=8,face="plain",color="grey30"),
axis.text = element_text(size=8,face="plain",color="grey30"),
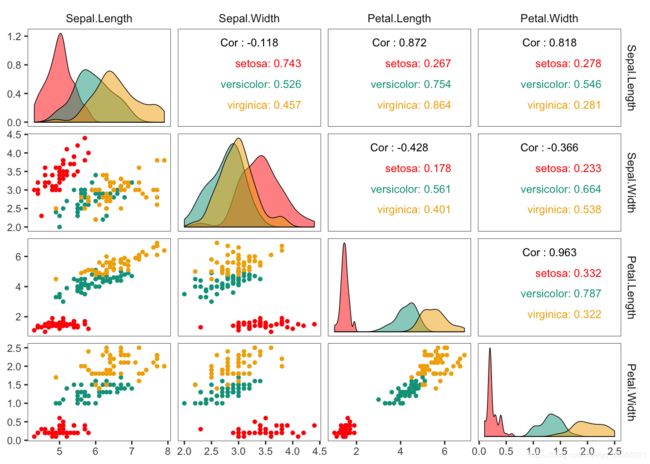
strip.background = element_blank())library(wesanderson)
ggpairs_theme <- theme_bw()+theme(panel.grid.major = element_blank(),
panel.grid.minor = element_blank(),
panel.border = element_rect( colour = "black", fill = NA,size=0.25),
axis.title=element_text(size=8,face="plain",color="grey30"),
axis.text = element_text(size=8,face="plain",color="grey30"),
strip.background = element_blank())
ggplot <- function(...) ggplot2::ggplot(...) + scale_fill_manual(values=wes_palette(n=3, name="Darjeeling1"))+
scale_color_manual(values=wes_palette(n=3, name="Darjeeling1"))
#ggplot<-function(...) ggplot2::ggplot(...) + scale_colour_brewer(palette="Set1")
unlockBinding("ggplot",parent.env(asNamespace("GGally")))
assign("ggplot",ggplot,parent.env(asNamespace("GGally")))
ggpairs(iris, columns =1:4, mapping = ggplot2::aes(fill = Species,colour=Species),
lower=list(continuous = wrap("points",size=1,shape=21)),#,colour="black"
diag = list(continuous = wrap("densityDiag",alpha=0.5,colour="black",size=0.25)),
upper= list(continuous = wrap("cor",size = 3, alignPercent = 0.9)))+
ggpairs_theme热力图
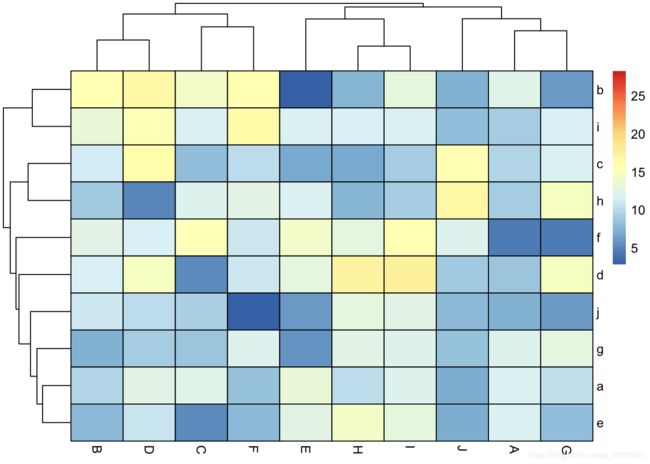
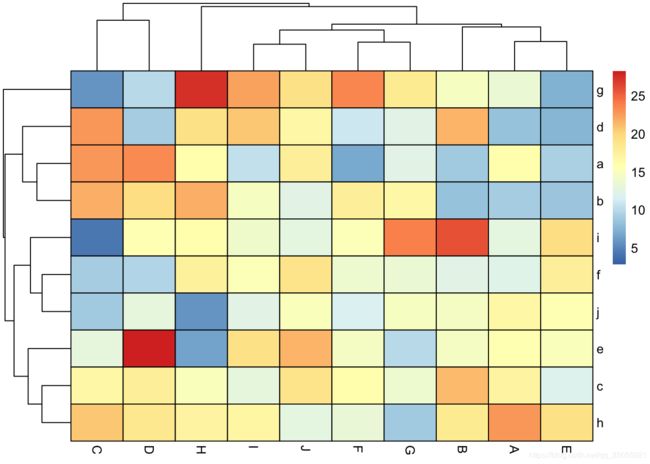
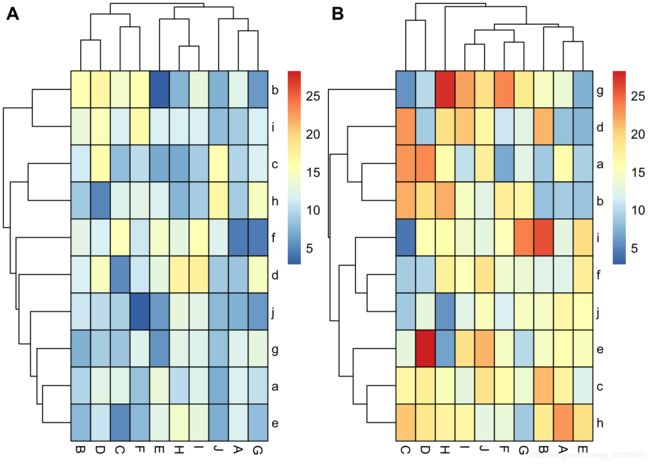
library(RColorBrewer)
library(pheatmap)
library(cowplot)
set.seed(12345)
df1<- data.frame(matrix(rnorm(100,10,3), ncol=10))
colnames(df1) <-LETTERS[1:10]
rownames(df1) <- letters[1:10]
df2<- data.frame(matrix(rnorm(100,15,5), ncol=10))
colnames(df2) <-LETTERS[1:10]
rownames(df2) <- letters[1:10]
Colormap <- colorRampPalette(rev(brewer.pal(n = 7, name = "RdYlBu")))(100)
breaks <- seq(min(unlist(c(df1, df2))), max(unlist(c(df1, df2))), length.out=100)
p1<- pheatmap(df1, color=Colormap, breaks=breaks,border_color="black",legend=TRUE)p2 <- pheatmap(df2, color=Colormap, breaks=breaks,border_color="black",legend=TRUE)plot_grid( p1$gtable, p2$gtable,align = 'vh',labels = c("A", "B"),ncol = 2)平行坐标图
library(GGally)

dlarge <-read.csv("配套资源/第8章 高维数据型图表/Parallel_Coordinates_Data.csv", header=TRUE,check.names=FALSE)


dlarge<-transform(dlarge, Class=ifelse(reading> 523, "Class1", "Class2"))

ggparcoord(data = dlarge, columns = 1:6, mapping=aes(color=Class),#groupColumn = 5, order = "anyClass",
           groupColumn=7,#"cut",
           showPoints = FALSE, boxplot = FALSE,#title = "Parallel Coordinate Plot for the Iris Data",
           alphaLines = 0.7)+#,,splineFactor =TRUE
  scale_x_discrete(position = "top")+
  scale_colour_manual(values=c("#90C539","#45BFFC" ))+
  xlab("")+
  theme_minimal()+
  theme(
    #strip.text = element_text(size=13,face="plain",color="black"),
    #text=element_text(size=12,face="plain",color="black"),
    axis.title=element_text(size=15,face="plain",color="black"),
    axis.text = element_text(size=10,face="plain",color="black"),
    panel.grid.major.y=element_blank(),
    panel.grid.minor.y=element_blank(),
    panel.grid.major.x=element_line(size=1),
    legend.text  = element_text(size=11,face="plain",color="black"),
    legend.title =element_blank(),
    #legend.position = "right",
    axis.line.y=element_line(size=1,colour="grey70"),
    axis.ticks.y=element_line(size=1,colour="grey70"),
    legend.position=c(0.82,0.1)
    #legend.background = element_rect(fill=alpha("white",0))
  )