Python画散点图和三维图之seaborn
import matplotlib.pyplot as plt
import numpy as np
import seaborn as sns
import pandas as pd
df=pd.DataFrame({'x': range(1,101), 'y': np.random.randn(100)*15+range(1,101) })

my_dpi=96
plt.figure(figsize=(480/my_dpi, 480/my_dpi), dpi=my_dpi)

plt.plot( 'x', 'y', data=df, linestyle='none', marker='o')
plt.show()
import matplotlib.pyplot as plt
import numpy as np
import seaborn as sns
import pandas as pd
df=pd.DataFrame({'x': range(1,101), 'y': np.random.randn(100)*80+range(1,101) })

my_dpi=96
plt.figure(figsize=(480/my_dpi, 480/my_dpi), dpi=my_dpi)

plt.plot( 'x', 'y', data=df, linestyle='none', marker='*')
plt.show()
import matplotlib.pyplot as plt
import numpy as np
import seaborn as sns
import pandas as pd
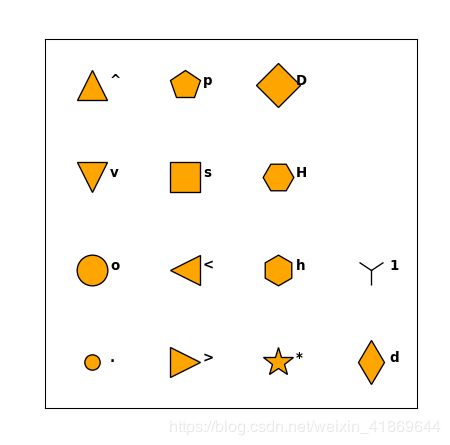
all_poss=['.','o','v','^','>','<','s','p','*','h','H','D','d','1','','']

my_dpi=96
plt.figure(figsize=(480/my_dpi, 480/my_dpi), dpi=my_dpi)

plt.xlim(0.5,4.5)
plt.ylim(0.5,4.5)

plt.xticks([])
plt.yticks([])

num=0
for x in range(1,5):
    for y in range(1,5):
        num += 1
        plt.plot(x,y,marker=all_poss[num-1], markerfacecolor='orange', markersize=23, markeredgecolor="black")
        plt.text(x+0.2, y, all_poss[num-1], horizontalalignment='left', size='medium', color='black', weight='semibold')
plt.show()
import matplotlib.pyplot as plt
import numpy as np
import seaborn as sns
import pandas as pd
df=pd.DataFrame({'x': range(1,101), 'y': np.random.randn(100)*80+range(1,101) })
my_dpi=96
plt.figure(figsize=(480/my_dpi, 480/my_dpi), dpi=my_dpi)
plt.plot( 'x', 'y', data=df, linestyle='none', marker='D', markersize=16)
plt.show()import matplotlib.pyplot as plt
import numpy as np
import seaborn as sns
import pandas as pd
df=pd.DataFrame({'x': range(1,10), 'y': np.random.randn(9)*80+range(1,10) })
my_dpi=96
plt.figure(figsize=(480/my_dpi, 480/my_dpi), dpi=my_dpi)
plt.plot( 'x', 'y', data=df, linestyle='none', markerfacecolor='skyblue', marker="o", markeredgecolor="black", markersize=16)
plt.show()import matplotlib.pyplot as plt
import numpy as np
import seaborn as sns
import pandas as pd
df=pd.DataFrame({'x': range(1,10), 'y': np.random.randn(9)*80+range(1,10) })
my_dpi=96
plt.figure(figsize=(480/my_dpi, 480/my_dpi), dpi=my_dpi)
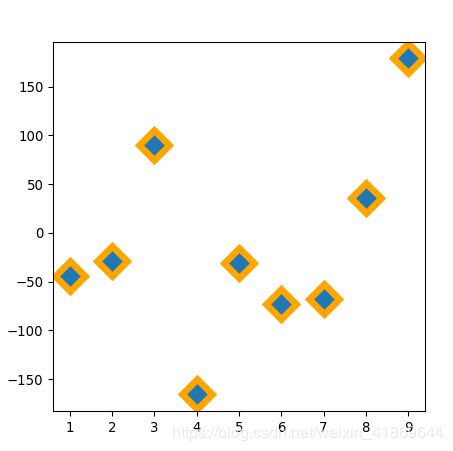
plt.plot( 'x', 'y', data=df, linestyle='none', marker='D', markersize=16, markeredgecolor="orange", markeredgewidth=5)
plt.show()import matplotlib.pyplot as plt
import numpy as np
import seaborn as sns
import pandas as pd
df=pd.DataFrame({'x': range(1,10), 'y': np.random.randn(9)*80+range(1,10) })
my_dpi=96
plt.figure(figsize=(480/my_dpi, 480/my_dpi), dpi=my_dpi)
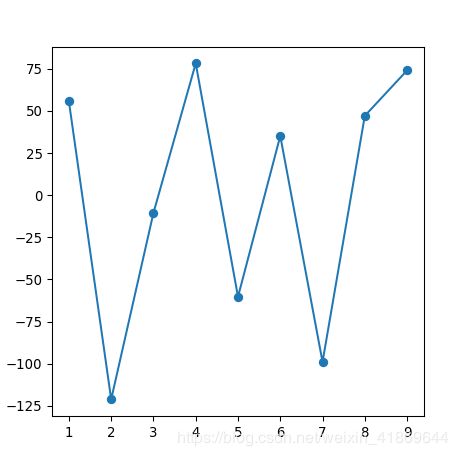
plt.plot( 'x', 'y', data=df, linestyle='-', marker='o')
plt.show()import matplotlib as mpl
import numpy as np
import matplotlib.pyplot as plt
t = np.linspace(0, 2 * np.pi, 20)
x = np.sin(t)
y = np.cos(t)
z=x
cmap, norm = mpl.colors.from_levels_and_colors([0, 2, 5, 6], ['red', 'green', 'blue'])
f, ax = plt.subplots()
ax.scatter(x, y, c=z, cmap=cmap, norm=norm)
plt.show()import numpy as np
import matplotlib.pyplot as plt
N = 10
data = np.random.random((N, 4))
labels = ['point{0}'.format(i) for i in range(N)]
plt.subplots_adjust(bottom = 0.1)
plt.scatter(
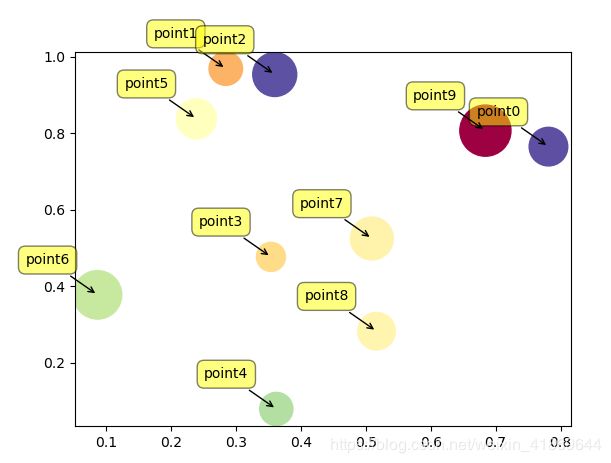
data[:, 0], data[:, 1], marker='o', c=data[:, 2], s=data[:, 3] * 1500,
cmap=plt.get_cmap('Spectral'))
for label, x, y in zip(labels, data[:, 0], data[:, 1]):
plt.annotate(
label,
xy=(x, y), xytext=(-20, 20),
textcoords='offset points', ha='right', va='bottom',
bbox=dict(boxstyle='round,pad=0.5', fc='yellow', alpha=0.5),
arrowprops=dict(arrowstyle = '->', connectionstyle='arc3,rad=0'))
plt.show()import matplotlib.pyplot as plt
import numpy as np
import seaborn as sns
import pandas as pd
plt.style.use('seaborn')
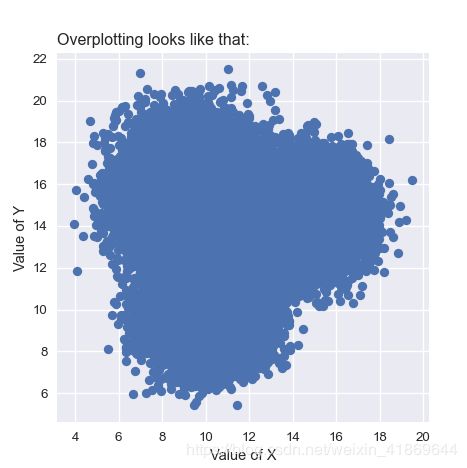
df=pd.DataFrame({'x': np.random.normal(10, 1.2, 20000), 'y': np.random.normal(10, 1.2, 20000), 'group': np.repeat('A',20000) })
tmp1=pd.DataFrame({'x': np.random.normal(14.5, 1.2, 20000), 'y': np.random.normal(14.5, 1.2, 20000), 'group': np.repeat('B',20000) })
tmp2=pd.DataFrame({'x': np.random.normal(9.5, 1.5, 20000), 'y': np.random.normal(15.5, 1.5, 20000), 'group': np.repeat('C',20000) })
df=df.append(tmp1).append(tmp2)
my_dpi=96
plt.figure(figsize=(480/my_dpi, 480/my_dpi), dpi=my_dpi)
plt.plot( 'x', 'y', data=df, linestyle='', marker='o')
plt.xlabel('Value of X')
plt.ylabel('Value of Y')
plt.title('Overplotting looks like that:', loc='left')
plt.show()import matplotlib.pyplot as plt
import numpy as np
import seaborn as sns
import pandas as pd
plt.style.use('seaborn')
df=pd.DataFrame({'x': np.random.normal(10, 1.2, 20000), 'y': np.random.normal(10, 1.2, 20000), 'group': np.repeat('A',20000) })
tmp1=pd.DataFrame({'x': np.random.normal(14.5, 1.2, 20000), 'y': np.random.normal(14.5, 1.2, 20000), 'group': np.repeat('B',20000) })
tmp2=pd.DataFrame({'x': np.random.normal(9.5, 1.5, 20000), 'y': np.random.normal(15.5, 1.5, 20000), 'group': np.repeat('C',20000) })
df=df.append(tmp1).append(tmp2)
my_dpi=96
plt.figure(figsize=(480/my_dpi, 480/my_dpi), dpi=my_dpi)
plt.plot( 'x', 'y', data=df, linestyle='', marker='o', markersize=0.7)
plt.xlabel('Value of X')
plt.ylabel('Value of Y')
plt.title('Overplotting? Try to reduce the dot size', loc='left')
plt.show()import matplotlib.pyplot as plt
import numpy as np
import seaborn as sns
import pandas as pd
plt.style.use('seaborn')
df=pd.DataFrame({'x': np.random.normal(10, 1.2, 20000), 'y': np.random.normal(10, 1.2, 20000), 'group': np.repeat('A',20000) })
tmp1=pd.DataFrame({'x': np.random.normal(14.5, 1.2, 20000), 'y': np.random.normal(14.5, 1.2, 20000), 'group': np.repeat('B',20000) })
tmp2=pd.DataFrame({'x': np.random.normal(9.5, 1.5, 20000), 'y': np.random.normal(15.5, 1.5, 20000), 'group': np.repeat('C',20000) })
df=df.append(tmp1).append(tmp2)
my_dpi=96
plt.figure(figsize=(480/my_dpi, 480/my_dpi), dpi=my_dpi)
plt.plot( 'x', 'y', data=df, linestyle='', marker='o', markersize=3, alpha=0.05, color="purple")
plt.xlabel('Value of X')
plt.ylabel('Value of Y')
plt.title('Overplotting? Try to use transparency', loc='left')
plt.show()import matplotlib.pyplot as plt
import numpy as np
import seaborn as sns
import pandas as pd
plt.style.use('seaborn')
df=pd.DataFrame({'x': np.random.normal(10, 1.2, 20000), 'y': np.random.normal(10, 1.2, 20000), 'group': np.repeat('A',20000) })
tmp1=pd.DataFrame({'x': np.random.normal(14.5, 1.2, 20000), 'y': np.random.normal(14.5, 1.2, 20000), 'group': np.repeat('B',20000) })
tmp2=pd.DataFrame({'x': np.random.normal(9.5, 1.5, 20000), 'y': np.random.normal(15.5, 1.5, 20000), 'group': np.repeat('C',20000) })
df=df.append(tmp1).append(tmp2)
my_dpi=96
plt.figure(figsize=(480/my_dpi, 480/my_dpi), dpi=my_dpi)
sns.kdeplot(df.x, df.y, cmap="Reds", shade=True)
plt.title('Overplotting? Try 2D density graph', loc='left')
plt.show()import matplotlib.pyplot as plt
import numpy as np
import seaborn as sns
import pandas as pd
plt.style.use('seaborn')
df=pd.DataFrame({'x': np.random.normal(10, 1.2, 20000), 'y': np.random.normal(10, 1.2, 20000), 'group': np.repeat('A',20000) })
tmp1=pd.DataFrame({'x': np.random.normal(14.5, 1.2, 20000), 'y': np.random.normal(14.5, 1.2, 20000), 'group': np.repeat('B',20000) })
tmp2=pd.DataFrame({'x': np.random.normal(9.5, 1.5, 20000), 'y': np.random.normal(15.5, 1.5, 20000), 'group': np.repeat('C',20000) })
df=df.append(tmp1).append(tmp2)
my_dpi=96
plt.figure(figsize=(480/my_dpi, 480/my_dpi), dpi=my_dpi)
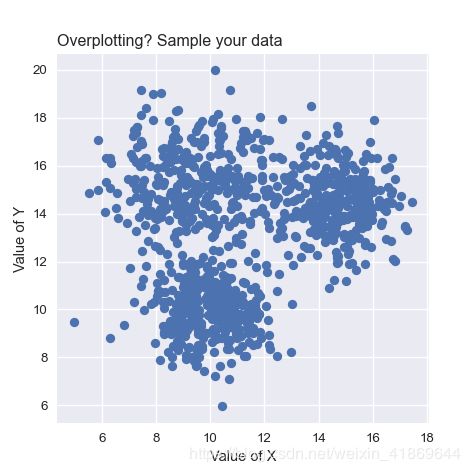
df_sample=df.sample(1000)
plt.plot( 'x', 'y', data=df_sample, linestyle='', marker='o')
plt.xlabel('Value of X')
plt.ylabel('Value of Y')
plt.title('Overplotting? Sample your data', loc='left')
plt.show()import matplotlib.pyplot as plt
import numpy as np
import seaborn as sns
import pandas as pd
plt.style.use('seaborn')
df=pd.DataFrame({'x': np.random.normal(10, 1.2, 20000), 'y': np.random.normal(10, 1.2, 20000), 'group': np.repeat('A',20000) })
tmp1=pd.DataFrame({'x': np.random.normal(14.5, 1.2, 20000), 'y': np.random.normal(14.5, 1.2, 20000), 'group': np.repeat('B',20000) })
tmp2=pd.DataFrame({'x': np.random.normal(9.5, 1.5, 20000), 'y': np.random.normal(15.5, 1.5, 20000), 'group': np.repeat('C',20000) })
df=df.append(tmp1).append(tmp2)
my_dpi=96
plt.figure(figsize=(480/my_dpi, 480/my_dpi), dpi=my_dpi)
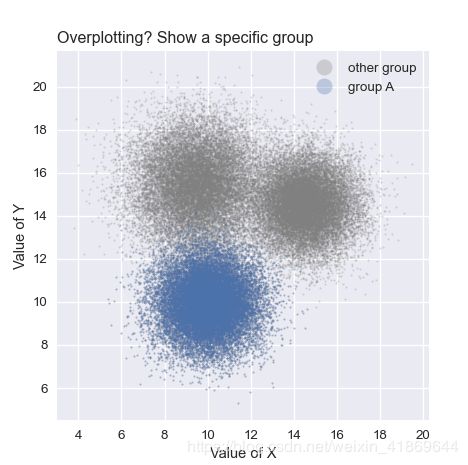
df_filtered = df[ df['group'] == 'A']
plt.plot( 'x', 'y', data=df, linestyle='', marker='o', markersize=1.5, color="grey", alpha=0.3, label='other group')
plt.plot( 'x', 'y', data=df_filtered, linestyle='', marker='o', markersize=1.5, alpha=0.3, label='group A')
plt.legend(markerscale=8)
plt.xlabel('Value of X')
plt.ylabel('Value of Y')
plt.title('Overplotting? Show a specific group', loc='left')
plt.show()import matplotlib.pyplot as plt
import numpy as np
import seaborn as sns
import pandas as pd
plt.style.use('seaborn')
df=pd.DataFrame({'x': np.random.normal(10, 1.2, 20000), 'y': np.random.normal(10, 1.2, 20000), 'group': np.repeat('A',20000) })
tmp1=pd.DataFrame({'x': np.random.normal(14.5, 1.2, 20000), 'y': np.random.normal(14.5, 1.2, 20000), 'group': np.repeat('B',20000) })
tmp2=pd.DataFrame({'x': np.random.normal(9.5, 1.5, 20000), 'y': np.random.normal(15.5, 1.5, 20000), 'group': np.repeat('C',20000) })
df=df.append(tmp1).append(tmp2)
my_dpi=96
plt.figure(figsize=(480/my_dpi, 480/my_dpi), dpi=my_dpi)
df_filtered = df[ df['group'] == 'A']
sns.lmplot( x="x", y="y", data=df, fit_reg=False, hue='group', legend=False, palette="Accent", scatter_kws={"alpha":0.1,"s":15} )
plt.legend(loc='lower right', markerscale=2)
plt.xlabel('Value of X')
plt.ylabel('Value of Y')
plt.title('Overplotting? Show putative structure', loc='left')
plt.show()import matplotlib.pyplot as plt
import numpy as np
import seaborn as sns
import pandas as pd
plt.style.use('seaborn')
df=pd.DataFrame({'x': np.random.normal(10, 1.2, 20000), 'y': np.random.normal(10, 1.2, 20000), 'group': np.repeat('A',20000) })
tmp1=pd.DataFrame({'x': np.random.normal(14.5, 1.2, 20000), 'y': np.random.normal(14.5, 1.2, 20000), 'group': np.repeat('B',20000) })
tmp2=pd.DataFrame({'x': np.random.normal(9.5, 1.5, 20000), 'y': np.random.normal(15.5, 1.5, 20000), 'group': np.repeat('C',20000) })
df=df.append(tmp1).append(tmp2)
my_dpi=96
plt.figure(figsize=(480/my_dpi, 480/my_dpi), dpi=my_dpi)
df_filtered = df[ df['group'] == 'A']
g = sns.FacetGrid(df, col="group", hue="group")
g = (g.map(plt.scatter, "x", "y", edgecolor="w"))
plt.show()import matplotlib.pyplot as plt
import numpy as np
import seaborn as sns
import pandas as pd
plt.style.use('seaborn')
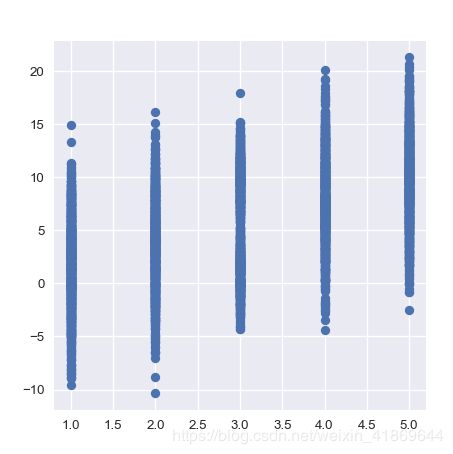
a=np.concatenate([np.random.normal(2, 4, 1000), np.random.normal(4, 4, 1000), np.random.normal(1, 2, 500), np.random.normal(10, 2, 500), np.random.normal(8, 4, 1000), np.random.normal(10, 4, 1000)])
df=pd.DataFrame({'x': np.repeat( range(1,6), 1000), 'y': a })
my_dpi=96
plt.figure(figsize=(480/my_dpi, 480/my_dpi), dpi=my_dpi)
plt.plot( 'x', 'y', data=df, linestyle='', marker='o')
plt.show()import matplotlib.pyplot as plt
import numpy as np
import seaborn as sns
import pandas as pd
plt.style.use('seaborn')
a=np.concatenate([np.random.normal(2, 4, 1000), np.random.normal(4, 4, 1000), np.random.normal(1, 2, 500), np.random.normal(10, 2, 500), np.random.normal(8, 4, 1000), np.random.normal(10, 4, 1000)])
df=pd.DataFrame({'x': np.repeat( range(1,6), 1000), 'y': a })
my_dpi=96
plt.figure(figsize=(480/my_dpi, 480/my_dpi), dpi=my_dpi)
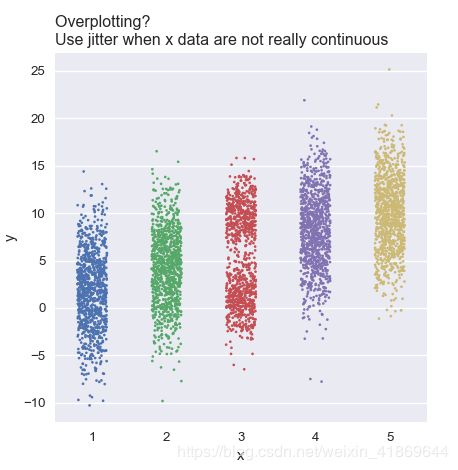
sns.stripplot(df.x, df.y, jitter=0.2, size=2)
plt.title('Overplotting? \nUse jitter when x data are not really continuous', loc='left')
plt.show()
from scipy.stats import kde
from mpl_toolkits.mplot3d import Axes3D
import matplotlib.pyplot as plt
import numpy as np
import pandas as pd
a=np.concatenate([np.random.normal(2, 4, 1000), np.random.normal(4, 4, 1000), np.random.normal(1, 2, 500), np.random.normal(10, 2, 500), np.random.normal(8, 4, 1000), np.random.normal(10, 4, 1000)])
df=pd.DataFrame({'x': np.repeat( range(1,6), 1000), 'y': a })

nbins=300
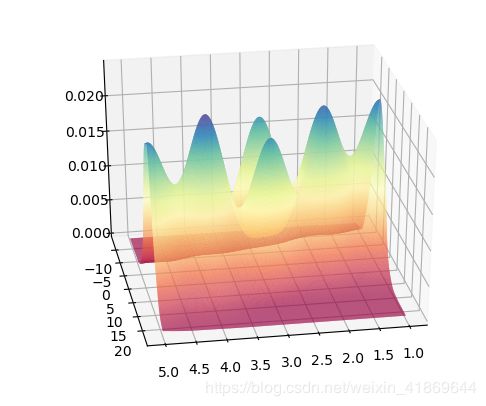
k = kde.gaussian_kde([df.x,df.y])
xi, yi = np.mgrid[ df.x.min():df.x.max():nbins*1j,  df.y.min():df.y.max():nbins*1j]
zi = k(np.vstack([xi.flatten(), yi.flatten()]))

# 转换数据格式
data=pd.DataFrame({'x': xi.flatten(), 'y': yi.flatten(), 'z': zi  })


# 画图
fig = plt.figure()
ax = fig.gca(projection='3d')
ax.plot_trisurf(data.x, data.y, data.z, cmap=plt.cm.Spectral, linewidth=0.2)
# 调整角度,第一个数字为上下,第二个数字为左右。
ax.view_init(30, 80)
plt.show()
本博主新开公众号, 希望大家能扫码关注一下,十分感谢大家。
本文来自:https://github.com/holtzy/The-Python-Graph-Gallery/blob/master/PGG_notebook.py


