MachineLearning02 线性回归示例
文章目录
- 线性回归示例
- 说明
- 熟悉numpy
- 单变量线性回归
- 梯度下降
- 补充说明start
- 补充说明end
- 预测
线性回归示例
- 下面的几个是jupyter notebook里的目录,csdn不支持
- 熟悉numpy
- 单变量线性回归
- 梯度下降
- 补充start
- 补充end
说明
本文代码部分源自 寒小阳 , 附上csdn地址
https://blog.csdn.net/han_xiaoyang
其中注释以及部分修改为我编写, 学习交流,欢迎留言
本人电脑使用版本如下:
jupyter==1.0.0
ipython==7.5.0
matplotlib==3.2.0
numpy==1.16.3
pandas==1.0.1
scikit-learn==0.21.0
# %load ../../standard_import.txt
import pandas as pd
import numpy as np
import matplotlib.pyplot as plt

from sklearn.linear_model import LinearRegression
# from mpl_toolkits.mplot3d import axes3d

pd.set_option('display.notebook_repr_html', False)
pd.set_option('display.max_columns', None)
pd.set_option('display.max_rows', 150)
pd.set_option('display.max_seq_items', None)

#%config InlineBackend.figure_formats = {'pdf',}
#调用matplotlib.pyplot的绘图函数plot()的时候,或者生成一个figure画布的时候,可以直接在你的python console里面生成图像。
#而我们在spyder或者pycharm实际运行代码的时候,可以直接注释掉这一句,也是可以运行成功的。


%matplotlib inline
# seaborn是在matplotlib基础上作了一系列改进.绘图流程简单, 图形美观
# import seaborn as sns
# sns.set_context('notebook')
# sns.set_style('white')
熟悉numpy
def warmUpExercise():
    return(np.identity(5))
warmUpExercise()
array([[1., 0., 0., 0., 0.],
       [0., 1., 0., 0., 0.],
       [0., 0., 1., 0., 0.],
       [0., 0., 0., 1., 0.],
       [0., 0., 0., 0., 1.]])
# np.c_ 是按行连接两个矩阵,就是把两矩阵左右相加,要求(列向量)行数相等
a=np.c_[[1,2,3],[4,5,6]]
a
array([[1, 4],
       [2, 5],
       [3, 6]])
单变量线性回归
data = np.loadtxt('linear_regression_data1.txt', delimiter=',') # delimiter 分隔符
# np.ones np.zeros 快速生成 0,1 的n维数组,有三个参数:
# shape(用来指定返回数组的大小/data.shape[0]读取第一维度长度(最高维),在这里是数据的行数)、dtype(数组元素的类型/np.int)、order(是否以内存中的C或Fortran连续(行或列)顺序存储多维数据)。
# 后两个参数都是可选的,一般只需设定第一个参数。
np.ones(data.shape[0])
array([1., 1., 1., 1., 1., 1., 1., 1., 1., 1., 1., 1., 1., 1., 1., 1., 1.,
       1., 1., 1., 1., 1., 1., 1., 1., 1., 1., 1., 1., 1., 1., 1., 1., 1.,
       1., 1., 1., 1., 1., 1., 1., 1., 1., 1., 1., 1., 1., 1., 1., 1., 1.,
       1., 1., 1., 1., 1., 1., 1., 1., 1., 1., 1., 1., 1., 1., 1., 1., 1.,
       1., 1., 1., 1., 1., 1., 1., 1., 1., 1., 1., 1., 1., 1., 1., 1., 1.,
       1., 1., 1., 1., 1., 1., 1., 1., 1., 1., 1., 1.])
# 冒号左边是行范围,冒号右边列范围
data[:,0]
array([ 6.1101,  5.5277,  8.5186,  7.0032,  5.8598,  8.3829,  7.4764,
        8.5781,  6.4862,  5.0546,  5.7107, 14.164 ,  5.734 ,  8.4084,
        5.6407,  5.3794,  6.3654,  5.1301,  6.4296,  7.0708,  6.1891,
       20.27  ,  5.4901,  6.3261,  5.5649, 18.945 , 12.828 , 10.957 ,
       13.176 , 22.203 ,  5.2524,  6.5894,  9.2482,  5.8918,  8.2111,
        7.9334,  8.0959,  5.6063, 12.836 ,  6.3534,  5.4069,  6.8825,
       11.708 ,  5.7737,  7.8247,  7.0931,  5.0702,  5.8014, 11.7   ,
        5.5416,  7.5402,  5.3077,  7.4239,  7.6031,  6.3328,  6.3589,
        6.2742,  5.6397,  9.3102,  9.4536,  8.8254,  5.1793, 21.279 ,
       14.908 , 18.959 ,  7.2182,  8.2951, 10.236 ,  5.4994, 20.341 ,
       10.136 ,  7.3345,  6.0062,  7.2259,  5.0269,  6.5479,  7.5386,
        5.0365, 10.274 ,  5.1077,  5.7292,  5.1884,  6.3557,  9.7687,
        6.5159,  8.5172,  9.1802,  6.002 ,  5.5204,  5.0594,  5.7077,
        7.6366,  5.8707,  5.3054,  8.2934, 13.394 ,  5.4369])
# np.c_ 是按行连接两个矩阵,就是把两矩阵左右相加,要求(列向量)行数相等
# 为什么X要取两个呢,因为在特征X中增加一维x0=1,表示截距项,即一直线当x=0时y的值。X=[X0,X1],加上斜率就是两项
X = np.c_[np.ones(data.shape[0]),data[:,0]]
X
array([[ 1.    ,  6.1101],
       [ 1.    ,  5.5277],
       [ 1.    ,  8.5186],
       [ 1.    ,  7.0032],
       [ 1.    ,  5.8598],
       [ 1.    ,  8.3829],
       [ 1.    ,  7.4764],
       [ 1.    ,  8.5781],
       [ 1.    ,  6.4862],
       [ 1.    ,  5.0546],
       [ 1.    ,  5.7107],
       [ 1.    , 14.164 ],
       [ 1.    ,  5.734 ],
       [ 1.    ,  8.4084],
       [ 1.    ,  5.6407],
       [ 1.    ,  5.3794],
       [ 1.    ,  6.3654],
       [ 1.    ,  5.1301],
       [ 1.    ,  6.4296],
       [ 1.    ,  7.0708],
       [ 1.    ,  6.1891],
       [ 1.    , 20.27  ],
       [ 1.    ,  5.4901],
       [ 1.    ,  6.3261],
       [ 1.    ,  5.5649],
       [ 1.    , 18.945 ],
       [ 1.    , 12.828 ],
       [ 1.    , 10.957 ],
       [ 1.    , 13.176 ],
       [ 1.    , 22.203 ],
       [ 1.    ,  5.2524],
       [ 1.    ,  6.5894],
       [ 1.    ,  9.2482],
       [ 1.    ,  5.8918],
       [ 1.    ,  8.2111],
       [ 1.    ,  7.9334],
       [ 1.    ,  8.0959],
       [ 1.    ,  5.6063],
       [ 1.    , 12.836 ],
       [ 1.    ,  6.3534],
       [ 1.    ,  5.4069],
       [ 1.    ,  6.8825],
       [ 1.    , 11.708 ],
       [ 1.    ,  5.7737],
       [ 1.    ,  7.8247],
       [ 1.    ,  7.0931],
       [ 1.    ,  5.0702],
       [ 1.    ,  5.8014],
       [ 1.    , 11.7   ],
       [ 1.    ,  5.5416],
       [ 1.    ,  7.5402],
       [ 1.    ,  5.3077],
       [ 1.    ,  7.4239],
       [ 1.    ,  7.6031],
       [ 1.    ,  6.3328],
       [ 1.    ,  6.3589],
       [ 1.    ,  6.2742],
       [ 1.    ,  5.6397],
       [ 1.    ,  9.3102],
       [ 1.    ,  9.4536],
       [ 1.    ,  8.8254],
       [ 1.    ,  5.1793],
       [ 1.    , 21.279 ],
       [ 1.    , 14.908 ],
       [ 1.    , 18.959 ],
       [ 1.    ,  7.2182],
       [ 1.    ,  8.2951],
       [ 1.    , 10.236 ],
       [ 1.    ,  5.4994],
       [ 1.    , 20.341 ],
       [ 1.    , 10.136 ],
       [ 1.    ,  7.3345],
       [ 1.    ,  6.0062],
       [ 1.    ,  7.2259],
       [ 1.    ,  5.0269],
       [ 1.    ,  6.5479],
       [ 1.    ,  7.5386],
       [ 1.    ,  5.0365],
       [ 1.    , 10.274 ],
       [ 1.    ,  5.1077],
       [ 1.    ,  5.7292],
       [ 1.    ,  5.1884],
       [ 1.    ,  6.3557],
       [ 1.    ,  9.7687],
       [ 1.    ,  6.5159],
       [ 1.    ,  8.5172],
       [ 1.    ,  9.1802],
       [ 1.    ,  6.002 ],
       [ 1.    ,  5.5204],
       [ 1.    ,  5.0594],
       [ 1.    ,  5.7077],
       [ 1.    ,  7.6366],
       [ 1.    ,  5.8707],
       [ 1.    ,  5.3054],
       [ 1.    ,  8.2934],
       [ 1.    , 13.394 ],
       [ 1.    ,  5.4369]])
# 左右相加
y = np.c_[data[:,1]]
y
array([[17.592  ],
       [ 9.1302 ],
       [13.662  ],
       [11.854  ],
       [ 6.8233 ],
       [11.886  ],
       [ 4.3483 ],
       [12.     ],
       [ 6.5987 ],
       [ 3.8166 ],
       [ 3.2522 ],
       [15.505  ],
       [ 3.1551 ],
       [ 7.2258 ],
       [ 0.71618],
       [ 3.5129 ],
       [ 5.3048 ],
       [ 0.56077],
       [ 3.6518 ],
       [ 5.3893 ],
       [ 3.1386 ],
       [21.767  ],
       [ 4.263  ],
       [ 5.1875 ],
       [ 3.0825 ],
       [22.638  ],
       [13.501  ],
       [ 7.0467 ],
       [14.692  ],
       [24.147  ],
       [-1.22   ],
       [ 5.9966 ],
       [12.134  ],
       [ 1.8495 ],
       [ 6.5426 ],
       [ 4.5623 ],
       [ 4.1164 ],
       [ 3.3928 ],
       [10.117  ],
       [ 5.4974 ],
       [ 0.55657],
       [ 3.9115 ],
       [ 5.3854 ],
       [ 2.4406 ],
       [ 6.7318 ],
       [ 1.0463 ],
       [ 5.1337 ],
       [ 1.844  ],
       [ 8.0043 ],
       [ 1.0179 ],
       [ 6.7504 ],
       [ 1.8396 ],
       [ 4.2885 ],
       [ 4.9981 ],
       [ 1.4233 ],
       [-1.4211 ],
       [ 2.4756 ],
       [ 4.6042 ],
       [ 3.9624 ],
       [ 5.4141 ],
       [ 5.1694 ],
       [-0.74279],
       [17.929  ],
       [12.054  ],
       [17.054  ],
       [ 4.8852 ],
       [ 5.7442 ],
       [ 7.7754 ],
       [ 1.0173 ],
       [20.992  ],
       [ 6.6799 ],
       [ 4.0259 ],
       [ 1.2784 ],
       [ 3.3411 ],
       [-2.6807 ],
       [ 0.29678],
       [ 3.8845 ],
       [ 5.7014 ],
       [ 6.7526 ],
       [ 2.0576 ],
       [ 0.47953],
       [ 0.20421],
       [ 0.67861],
       [ 7.5435 ],
       [ 5.3436 ],
       [ 4.2415 ],
       [ 6.7981 ],
       [ 0.92695],
       [ 0.152  ],
       [ 2.8214 ],
       [ 1.8451 ],
       [ 4.2959 ],
       [ 7.2029 ],
       [ 1.9869 ],
       [ 0.14454],
       [ 9.0551 ],
       [ 0.61705]])
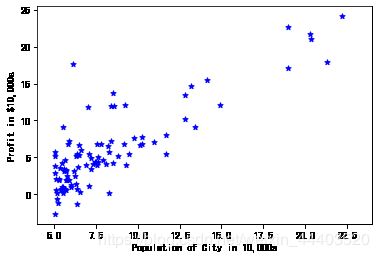
# x取所有行,第二列;y即y; s:散点的大小; c散点颜色marker点样式;linewidths 线宽
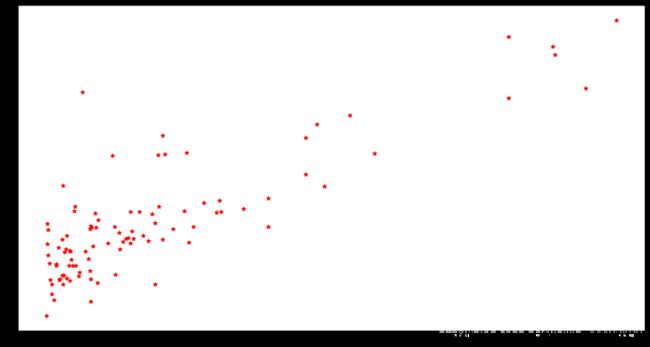
plt.figure(figsize=(15, 8))

plt.scatter(X[:,1], y, s=30, c='r', marker='*', linewidths=1)
# plt.figure(figsize=(15, 8))
plt.scatter(X[:,1], y, s=30, c='blue', marker='*', linewidths=1)

plt.xlim(4,24) # x轴截取画布显示范围(y轴自适应)
plt.xlabel('Population of City in 10,000s')
plt.ylabel('Profit in $10,000s');
梯度下降
theta=[[0],[0]]
theta
X.dot(theta) #.dot 点乘
array([[0.],
       [0.],
       [0.],
       [0.],
       [0.],
       [0.],
       [0.],
       [0.],
       [0.],
       [0.],
       [0.],
       [0.],
       [0.],
       [0.],
       [0.],
       [0.],
       [0.],
       [0.],
       [0.],
       [0.],
       [0.],
       [0.],
       [0.],
       [0.],
       [0.],
       [0.],
       [0.],
       [0.],
       [0.],
       [0.],
       [0.],
       [0.],
       [0.],
       [0.],
       [0.],
       [0.],
       [0.],
       [0.],
       [0.],
       [0.],
       [0.],
       [0.],
       [0.],
       [0.],
       [0.],
       [0.],
       [0.],
       [0.],
       [0.],
       [0.],
       [0.],
       [0.],
       [0.],
       [0.],
       [0.],
       [0.],
       [0.],
       [0.],
       [0.],
       [0.],
       [0.],
       [0.],
       [0.],
       [0.],
       [0.],
       [0.],
       [0.],
       [0.],
       [0.],
       [0.],
       [0.],
       [0.],
       [0.],
       [0.],
       [0.],
       [0.],
       [0.],
       [0.],
       [0.],
       [0.],
       [0.],
       [0.],
       [0.],
       [0.],
       [0.],
       [0.],
       [0.],
       [0.],
       [0.],
       [0.],
       [0.],
       [0.],
       [0.],
       [0.],
       [0.],
       [0.],
       [0.]])
Jupyter Notebook/csdn 提供LaTeX语法编辑公式,可参考
https://www.jianshu.com/p/93ccc63e5a1b
J α ( x ) = ∑ m = 0 ∞ ( − 1 ) m m ! Γ ( m + α + 1 ) ( x 2 ) 2 m + α ,公式示例 J_\alpha(x) = \sum_{m=0}^\infty \frac{(-1)^m}{m! \Gamma (m + \alpha + 1)} {\left({ \frac{x}{2} }\right)}^{2m + \alpha} \text {,公式示例} Jα(x)=m=0∑∞m!Γ(m+α+1)(−1)m(2x)2m+α,公式示例
J ( θ ) = 1 2 m ∑ i − 1 m ( y i − h θ ( x i ) ) 2 , 损失函数 J(\theta) = \frac{1}{2m}\sum_{i-1}^{m}{(y^i-h_\theta(x^i))^2} \text {, 损失函数} J(θ)=2m1i−1∑m(yi−hθ(xi))2, 损失函数
# 计算损失函数
def computeCost(X, y, theta=[[0],[0]]):
    m = y.size  # y.size #y元素总数,y是一维的行向量(对应np的一列),theta是一维列向量,是x0x1的参数初始值
    J = 0
    h = X.dot(theta) # 预测函数。X与参数初始值的点乘,出个一维行向量(预测的y值),得出的初始h为0
    J = 1.0/(2*m)*(np.sum(np.square(h-y)))  # 使用numpy计算损失函数

    return J
computeCost(X,y)
32.072733877455676
# 梯度下降
def gradientDescent(X, y, theta=[[0],[0]], alpha=0.01, num_iters=1500): # 步长0.01,迭代次数1500
    m = y.size
    J_history = np.zeros(num_iters) # 初始化1500个 J

    for iter in np.arange(num_iters):
        h = X.dot(theta)
        theta = theta - alpha*(1.0/m)*(X.T.dot(h-y)) #梯度下降方向为J函数对参数求导数为(1.0/m)*(X.T.dot(h-y))求导转置
        J_history[iter] = computeCost(X, y, theta)
    return(theta, J_history)
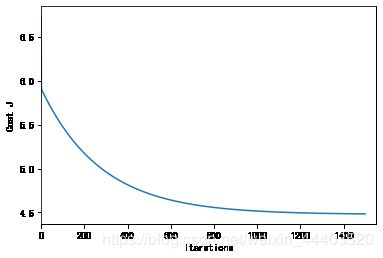
# 画出每一次迭代和损失函数变化
theta , Cost_J = gradientDescent(X, y)
print('theta: ',theta.ravel())

plt.plot(Cost_J) #如果你只输入一列数组,那么对应的x坐标是对应的序号0,1,2,3,4
plt.xlim(0,1550) # x轴截取画布显示范围(y轴自适应)

plt.ylabel('Cost J')
plt.xlabel('Iterations');
theta: [-3.63029144 1.16636235]
补充说明start
ravel(散开,解开),flatten(变平)。两者的区别在于返回拷贝(copy)还是返回视图(view),numpy.flatten()返回一份拷贝,对拷贝所做的修改不会影响(reflects)原始矩阵,而numpy.ravel()返回的是视图(view,也颇有几分C/C++引用reference的意味),会影响(reflects)原始矩阵。
x1=np.array([[1,2],[3,4]])
# 默认行序优先
x1.ravel()
array([1, 2, 3, 4])
x1.flatten()
array([1, 2, 3, 4])
#  传入F表示列序优先
x1.flatten('F')
array([1, 3, 2, 4])
x1.ravel('F')
array([1, 3, 2, 4])
x1.T.reshape(-1)
array([1, 3, 2, 4])
补充说明end
xx = np.arange(5,23)
yy = theta[0]+theta[1]*xx
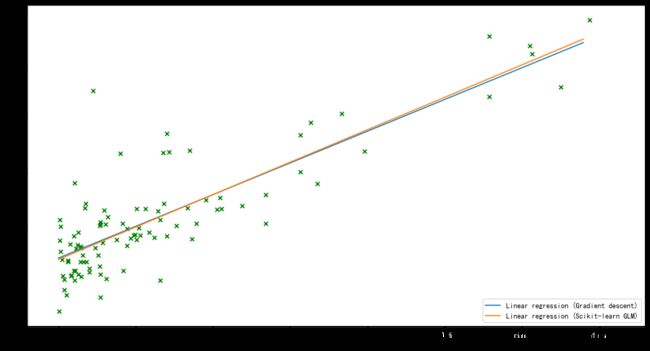
# 画出我们自己写的线性回归梯度下降收敛的情况
plt.figure(figsize=(15,8))
plt.scatter(X[:,1], y, s=30, c='g', marker='x', linewidths=1)
plt.plot(xx,yy, label='Linear regression (Gradient descent)')

# 和Scikit-learn中的线性回归对比一下
regr = LinearRegression()
regr.fit(X[:,1].reshape(-1,1), y.ravel()) # reshape(-1,1) 转换为1列,自适应n(-1)行
# intercept_截距 coef_斜率
plt.plot(xx, regr.intercept_+regr.coef_*xx, label='Linear regression (Scikit-learn GLM)')

plt.xlim(4,24)
plt.xlabel('Population of City in 10,000s')
plt.ylabel('Profit in $10,000s')
plt.legend(loc=4); # 图例位置,4:lower right
预测
# 预测一下人口为35000和70000的城市的结果
print(theta.T.dot([1, 3.5])*10000)
print(theta.T.dot([1, 7])*10000)
[4519.7678677]
[45342.45012945]


