python 画图横坐标显示百分比(日期)+以原点为起点+标签显示中文+旋转标签以完全显示坐标(附代码)
代码以及注释如下:
import numpy as np
import matplotlib.pyplot as plt
import math
import pandas as pd
import random
#日期引入
import matplotlib.dates as mdate
from matplotlib.font_manager import FontProperties
#百分比引入
from matplotlib.ticker import FuncFormatter
#中文标签引入
font_set = FontProperties(fname=r"c:\windows\fonts\simsun.ttc", size=12)
# encoding=utf-8
#百分比函数
def to_percent(temp, position):
     return '%1.0f'%(1*temp) + '%'
plt.rcParams['font.family'] = ['Times New Roman']


#纵坐标生成
num=100
y = np.linspace(0,num,21)

'''
######################
#生成横坐标刻度为百分比的图像

#横坐标(0,5,15~100),后期变成(0%,5%,15%~100%)
x= np.linspace(0,100,21)
print(x)
#调整画布大小
plt.figure(figsize=(12, 6.5))
plt.plot(x, y,'bo:')
plt.xticks(x)
#标题和标签显示中文
plt.xlabel('返回比例',fontproperties=font_set)
plt.ylabel('规模',fontproperties=font_set)
plt.title('规模比例图',fontproperties=font_set)
#坐标刻度显示百分比
#plt.gca().yaxis.set_major_formatter(FuncFormatter(to_percent))
plt.gca().xaxis.set_major_formatter(FuncFormatter(to_percent))
#将0,0与原点重合(若不想重合只要把这三句去掉即可)
ax = plt.gca()
ax.spines['bottom'].set_position(('data',-0))# outward,axes
ax.spines['left'].set_position(('data',0))
plt.show()
'''
#####################
#生成横坐标刻度为日期的图像

#显示所有日期
#横坐标显示日期(想要完全显示所有日期就要把这些全部写出来)
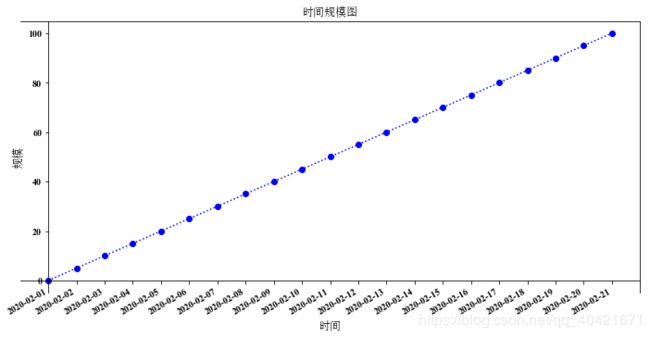
xs=['2020-02-01', '2020-02-02', '2020-02-03', '2020-02-04',
               '2020-02-05', '2020-02-06', '2020-02-07', '2020-02-08',
               '2020-02-09', '2020-02-10', '2020-02-11', '2020-02-12',
               '2020-02-13', '2020-02-14', '2020-02-15', '2020-02-16',
               '2020-02-17', '2020-02-18', '2020-02-19', '2020-02-20',
               '2020-02-21']
#显示部分日期
#这一句生成的日期与前面的日期数组一样,但是画图时会自行省略一些坐标点
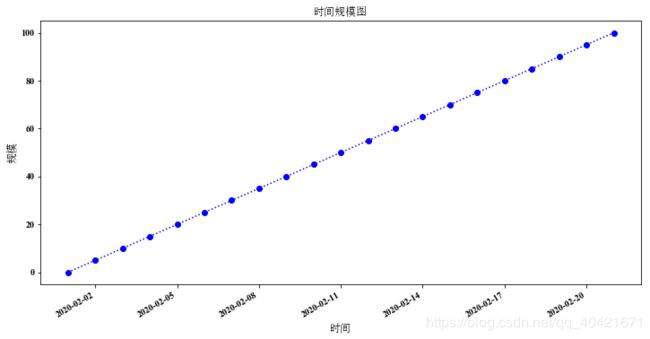
#xs=pd.date_range(start='20200201',end='20200221',freq='D')#生成2020-02-11类型的日期数组()
#print(xs)
plt.figure(figsize=(10, 6))
plt.plot(xs, y,'bo:')
plt.xlabel('时间',fontproperties=font_set)
plt.ylabel('规模',fontproperties=font_set)
plt.title('时间规模图',fontproperties=font_set)
plt.gcf().autofmt_xdate()#旋转标签,以显示完全
ax = plt.gca()
ax.spines['bottom'].set_position(('data',-0))# outward,axes
ax.spines['left'].set_position(('data',0))
plt.show()
生成百分比图 (以原点为起点)
生成日期图1(日期显示完全)
起点为原点
起点不为原点
生成日期图2(日期显示不完全)
起点不为原点


