线性判别分析LDA—西瓜书课后题3.5—MATLAB代码
题目:编程实现线性判别分析LDA,给出西瓜数据集 3.0a上的结果
简单说就是找一个分离度最大的投影方向,把数据投射上去。
clc
clear all
[num,txt]=xlsread('D:\机器学习\WaterMelon_3.0.xlsx');
%提取有效数据
data=num(1:end,[1,8,9]);
label_txt=txt([2:end],10);
label=ismember(label_txt,'是');
%整理所需数据
data=[data,label];
class1=data(find(label==1),[2,3]);
class2=data(find(label==0),[2,3]);

%核心代码
mu1=mean(class1);
mu2=mean(class2);
s1=cov(class1);
s2=cov(class2);
sw=s1+s2;
sb=(mu1-mu2)'*(mu1-mu2);
[V,D]=eig(inv(sw)*sb);
%取较大特征值对应的特征向量
w=V(:,2);
pre_value1=class1*w;
pre_value2=class2*w;
pre_value=[pre_value1;pre_value2];

%offset相当于y=w^Tx+b中的b值
offset=(mean(pre_value1)+mean(pre_value2))/2;
for i=1:length(pre_value)
    pre_value(i)=pre_value(i)-offset;
    %采用sigmod函数进行类别判断
    pre_label(i)=~round(1/(1+exp(- pre_value(i))));
end
data_out=[data,pre_value,pre_label'];
xlswrite('D:\机器学习\LDA数据输出.xls',data_out);

figure('NumberTitle', 'on', 'Name','给西瓜分个家_马存诗');
hold on;
grid on;
plot(class1(:,1),class1(:,2),'b*'),
plot(class2(:,1),class2(:,2),'r+'),
plot([0,-w(1)],[0,-w(2)]);
%求垂足画垂线
for i=1:length(label)
proj_point = ProjPoint( [data(i,2),data(i,3)],[0,0,-w(1),-w(2)]);
  if (i<=length(class1))
   plot(proj_point(1),proj_point(2),'b.');
   plot([data(i,2),proj_point(1)],[data(i,3),proj_point(2)],'--');
  else
   plot(proj_point(1),proj_point(2),'r.');
   plot([data(i,2),proj_point(1)],[data(i,3),proj_point(2)],'--');
  end
end
axis([0 0.8 0 0.6]);
title('LDA图示结果');

% ProjPoint函数:求投影垂足的函数
function proj_point = ProjPoint( point,line )
x1 = line(1);
y1 = line(2);
x2 = line(3);
y2 = line(4);
x3 = point(1);
y3 = point(2);
yk = ((x3-x2)*(x1-x2)*(y1-y2) + y3*(y1-y2)^2 + y2*(x1-x2)^2) / (norm([x1-x2,y1-y2])^2);
xk = ((x1-x2)*x2*(y1-y2) + (x1-x2)*(x1-x2)*(yk-y2)) / ((x1-x2)*(y1-y2));
if x1 == x2
    xk = x1;
end
if y1 == y2
    xk = x3;
end
proj_point = [xk,yk];
end
WaterMelon_3.0.xlsx数据集:
数据文件可去这儿下载:https://pan.baidu.com/s/1O_ZYNPvCudC97SdrQIOCQQ
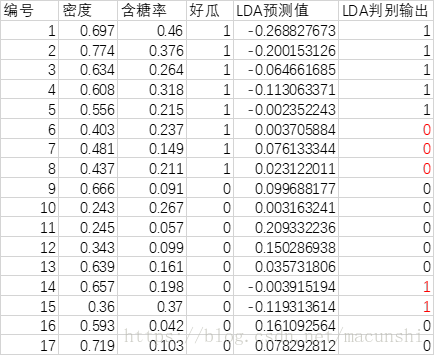
data_out输出结果:
offset的求取简化了,应该求两个正态的交点,我直接对两个均值求的平均值。
LDA图示结果:


