我的Kaggle初探--House Price Predict
本人对数据挖掘很感兴趣,在自学了python相关数据处理模块和部分机器学习算法后,尝试在kaggle上做实践,项目是房价预测,网上也有很多网友分享的好方法,自己整个顺下来算是对数据处理和挖掘有了初步的认识。
预处理
导入库
import numpy as np
import pandas as pd
import matplotlib.pyplot as plt
import scipy.stats as statsMM
import sklearn.linear_model as linear_model
import seaborn as sns
%matplotlib inline
plt.style.use('ggplot')

from sklearn.cluster import KMeans
numpy,pandas是数据处理常用的库,matplotlib,seaborn用来辅助画图分析,K-Means是我在处理neighborhood特征时用到的。
读入训练和测试数据
train = pd.read_csv('~/train.csv')#训练数据train
test = pd.read_csv('~/test.csv')#测试数据test
#训练集和测试集大小
print('original train set: ',train.shape)
print('original test set:',test.shape)
#since Id is unnecessary, save and drop it.
test_Id = test['Id']
test.drop('Id',axis=1,inplace=True)
train_Id = train['Id']
train.drop('Id',axis=1,inplace=True)
print('train drop Id:',train.shape)
print('test drop Id:',test.shape)
original train set:  (1460, 81)
original test set: (1459, 80)
train drop Id: (1460, 80)
test drop Id: (1459, 79)
特征相关性热力图分析
corrmat = train.corr()
f, ax = plt.subplots(figsize=(12, 9))
sns.heatmap(corrmat, vmax=.8, square=True)
按相关系数排序,与SalePrice相关性最强的10个特征是:
k = 10 #number of variables for heatmap
cols = corrmat.nlargest(k, 'SalePrice')['SalePrice'].index
cm = np.corrcoef(train[cols].values.T)
sns.set(font_scale=1.25)
hm = sns.heatmap(cm, cbar=True, annot=True, square=True, fmt='.2f', annot_kws={'size': 10}, yticklabels=cols.values, xticklabels=cols.values)
plt.show()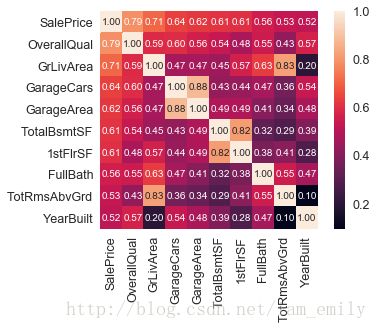
与SalePrice相关性较高的有 OverallQual, GrLivArea,GarageCars, GargeArea, TotalBsmtSF, 1stFlrSF, FullBath, TotRmsAbvGrd, YearBuilt, YearRemodAdd, GargeYrBlt, MasVnrArea and Fireplaces.
- 这其中,GarageArea和GarageCars,GarageYrBlt有很强的相关性,可以选择有代表性的GarageCars;
- TotalBsmtSF和1stFlrSF有很强相关性,可以作为新特征Basement分析;
- TotRmsAbvGrd与GrLivArea相似,取GrLivArea分析。
目标sale price特征
#since SalePrice is the target,drop and save it
y = train.SalePrice
train_labels = y.values.copy
#train.drop('SalePrice',axis=1,inplace=True)
print(y.describe())
sns.distplot(y)
print('Skewness: %f' %y.skew())
print('Kurtosis: %f' %y.kurt())
#sns.distplot(train['SalePrice'])
#print("Skewness: %f" % train['SalePrice'].skew())
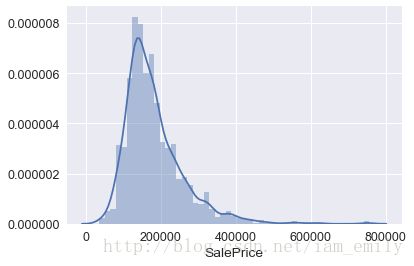
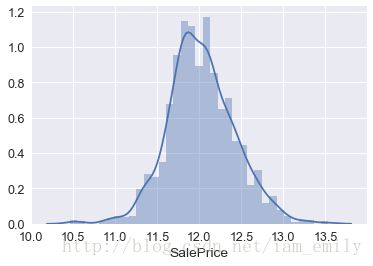
#print("Kurtosis: %f" % train['SalePrice'].kurt())positive skewness正偏态,可取对数使其满足正态分布,以方便用于机器学习算法
得到特征属性(数值和类别)
#得到训练集的数值特征和类别特征
num_f = [f for f in train.columns if train.dtypes[f] != 'object']#数值特征
# pop the target-Saleprice
num_f.pop() #pop the last one SalePrice
print('numerical feature length:',len(num_f))
category_f = [f for f in train.columns if train.dtypes[f] == 'object']#训练集类别特征
print('category feature length:',len(category_f))
numerical feature length: 36
category feature length: 43
数值特征num_f分析
def jointplot(x,y,**kwargs):
    try:
        sns.regplot(x=x,y=y)
    except Exception:
        print(x.value_counts())
f = pd.melt(train, id_vars=['SalePrice'], value_vars=num_f)
g = sns.FacetGrid(f,col='variable',col_wrap=3,sharex=False,sharey=False,size=5)
g = g.map(jointplot,'value','SalePrice')
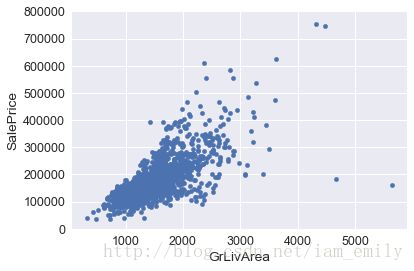
居住面积GrLivArea(数值特征)和price的关系
var = 'GrLivArea'
data = pd.concat([train['SalePrice'], train[var]], axis=1)
data.plot.scatter(x=var, y='SalePrice', ylim=(0,800000))
居住面积与价格呈明显的线性关系,例外是右下角两个点,面积大,售价低,不符合实际规律,可将其去掉:
train.drop(train[(train['GrLivArea']>4000)&(train.SalePrice<300000)].index,inplace=True)后面证明噪声点对结果影响很大,所以找到和去除噪声点很关键。
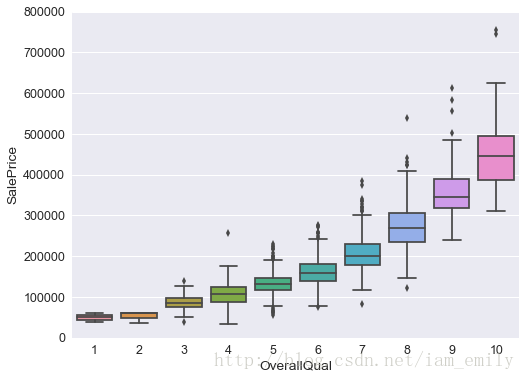
整体评价(数值特征)和价格关系
var = 'OverallQual'
data = pd.concat([train['SalePrice'], train[var]], axis=1)
f, ax = plt.subplots(figsize=(8, 6))
fig = sns.boxplot(x=var, y="SalePrice", data=data)
fig.axis(ymin=0, ymax=800000);
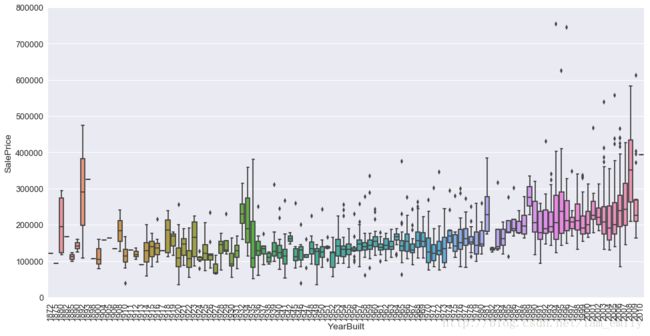
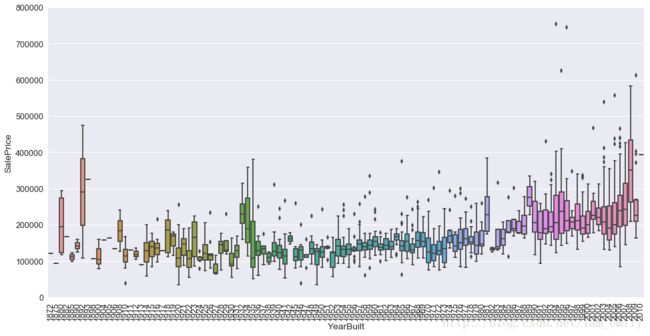
修建年代和价格关系
var = 'YearBuilt'
data = pd.concat([train['SalePrice'], train[var]], axis=1)
f, ax = plt.subplots(figsize=(16, 8))
fig = sns.boxplot(x=var, y="SalePrice", data=data)
fig.axis(ymin=0, ymax=800000)
plt.xticks(rotation=90)
Category特征分析
Category特征总体概览
''''
for c in category_f:
    train[c] = train[c].astype('category')
    if train[c].isnull().any():
        train[c] = train[c].cat.add_categories(['MISSING'])
        train[c] = train[c].fillna('MISSING')
'''''
def boxplot(x, y, **kwargs):
    sns.boxplot(x=x, y=y)
    x=plt.xticks(rotation=90)

f = pd.melt(train, id_vars=['SalePrice'], value_vars=category_f)
g = sns.FacetGrid(f, col="variable",  col_wrap=3, sharex=False,sharey=False,size=5)
g = g.map(boxplot, "value", "SalePrice")
对Price影响较大的有:Neighborhood波动较明显,SaleCondition中Partial稍高,QUAL类型(有无泳池、壁炉、地下室)
Category特征单因素方差分析
def anova(frame):
    anv = pd.DataFrame()
    anv['feature'] = category_f
    pvals = []
    for c in category_f:
        samples = []
        for cls in frame[c].unique():
            s = frame[frame[c] == cls]['SalePrice'].values
            samples.append(s)
        pval = statsMM.f_oneway(*samples)[1]
        pvals.append(pval)
    anv['pval'] = pvals
    return anv.sort_values('pval')

a = anova(train)
a['disparity'] = np.log(1./a['pval'].values)
sns.barplot(data=a, x='feature', y='disparity')
x=plt.xticks(rotation=90)
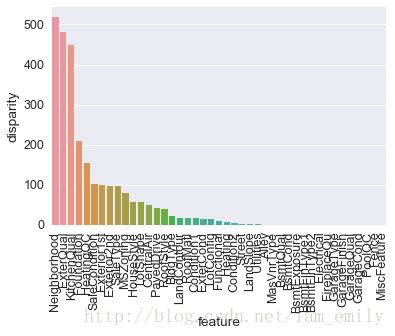
由上图示分析可见,不少离散变量的具体取值对最终房价会产生较大影响(例如Neighborhood这个变量,实际上暗含了地段这个影响房价的重要因素),因此,我们可以按照各离散变量相应取值下房价的均值来给各个取值划定一个1,2,3,4来定量描述他们对房价的影响,也就是将离散变量转化为数值型的有序变量:
Neighbourhood
#train.Neighborhood.astype("")
var = 'Neighborhood'
data = pd.concat([train['SalePrice'], train[var]], axis=1)
fig = sns.boxplot(x=var, y="SalePrice", data=data)
fig.axis(ymin=0, ymax=800000)
plt.xticks(rotation=90)
房价根据地段分类
地段对房价是很重要的影响因素,所以这里使用K-Means方法地段进行聚类
from sklearn.cluster import KMeans
data = data.groupby(by='Neighborhood').SalePrice.mean()
location = np.array(data.index)
price_lo = np.array(data.values).reshape(-1,1)
km = KMeans(n_clusters=3)
label = km.fit_predict(price_lo)#计算簇中心及为簇分配序号
expense = np.sum(km.cluster_centers_,axis=1)
CityCluster = [[],[],[]]
for i in range(len(location)):
    CityCluster[label[i]].append(location[i])
for i in range(len(CityCluster)):
    print("Expense:%.2f" % expense[i])
    print(CityCluster[i])
for i in range(len(expense)):
    print("Ratio:%.1f"%(expense[i]/sum(expense)))
nei_average = pd.Series(CityCluster[0]).drop_duplicates()
nei_exp = pd.Series(CityCluster[1]).drop_duplicates()
nei_cheap = pd.Series(CityCluster[2]).drop_duplicates()
对价格相近的地段取平均值,再按比例将不同地段进行赋值生成dictionary
nei_dict = dict()
new1 = dict()
new2 = dict()
nei_dict = nei_dict.fromkeys(['NoRidge', 'NridgHt', 'StoneBr'],5)
new1 = new1.fromkeys(['Blueste', 'BrDale', 'BrkSide', 'Edwards',
                              'IDOTRR', 'MeadowV', 'Mitchel', 'NAmes', 'NPkVill',
                              'OldTown', 'SWISU', 'Sawyer'],2)
new2 = new2.fromkeys(['Blmngtn', 'ClearCr', 'CollgCr', 'Crawfor', 'Gilbert',
                              'NWAmes', 'SawyerW', 'Somerst', 'Timber', 'Veenker'],3)
nei_dict.update(new1)
nei_dict.update(new2)
缺失值处理
NAs = pd.concat([train.isnull().sum(),train.isnull().sum()/train.isnull().count(),test.isnull().sum(),test.isnull().sum()/test.isnull().count()],axis=1,keys=["train","percent_train","test","percent"])
NAs[NAs.sum(axis=1)>1].sort_values(by="percent",ascending=False)
all_data = pd.concat([train,test],keys=["train","test"])
#对train和test中的所有数据进行缺失值处理- missing_col_NA:缺失即为没有的用“NA”来填充,数值类型补充为0。
missing_col_NA = ["Alley","MasVnrType","FireplaceQu","GarageType","PoolQC","Fence",
                   "MiscFeature","GarageQual","GarageCond","GarageFinish"]
missing_col_0 = ["MasVnrArea","GarageCars","GarageArea"]
for col in missing_col_NA:
     all_data[col].fillna("NA",inplace=True)
for col in missing_col_0:
all_data[col].fillna(0,inplace=True)- missing_col_mode:有的缺失数值可以用平均值,众数来补充。
missing_col_mode = ["MSZoning","KitchenQual","Functional","SaleType","Electrical","Exterior1st","Exterior2nd"]
for col in missing_col_mode:
    all_data[col].fillna(all_data[col].mode()[0],inplace=True)
all_data["LotFrontage"] = all_data.groupby("Neighborhood")["LotFrontage"].apply(lambda x:x.fillna(x.median()))
#all_data['LotFrontage'] = all_data.groupby("Neighborhood")["LotFrontage"].transform(lambda x:x.fillna(x.median()))- 缺失值中含有Bsm的,有无地下室进行处理:
#由于缺失值的个数是不一样的,所以只有BsmtCond和BsmtQual同时缺失,才将其认为是没有地下室的。
NoBmstIndex = (pd.isnull(all_data["BsmtCond"])==True)&(pd.isnull(all_data["BsmtQual"])==True)
all_data.loc[NoBmstIndex,"BsmtCond"] =all_data.loc[NoBmstIndex,"BsmtCond"].fillna("NA")
all_data.loc[NoBmstIndex,"BsmtQual"] =all_data.loc[NoBmstIndex,"BsmtQual"].fillna("NA")
all_data.loc[NoBmstIndex,"BsmtExposure"] =all_data.loc[NoBmstIndex,"BsmtExposure"].fillna("NA")
#其余的用众数来填充
all_data.BsmtCond.fillna(all_data.BsmtCond.mode()[0],inplace=True)
all_data.BsmtQual.fillna(all_data.BsmtQual.mode()[0],inplace=True)
all_data.BsmtExposure.fillna(all_data.BsmtExposure.mode()[0],inplace=True)
all_data.BsmtFinSF1.fillna(0,inplace=True)
all_data.BsmtFinSF2.fillna(0,inplace=True)
all_data.BsmtFinType1.fillna("NA",inplace=True)
all_data.BsmtFinType2.fillna("NA",inplace=True)
#要将没有地下室和地下室未完成的面积区分开,所以如果是未完成的,将其面积设为中位数
all_data.loc[all_data["BsmtFinType1"]=="Unf","BsmtFinSF1"]=all_data.BsmtFinSF1.median()
all_data.loc[all_data["BsmtFinType2"]=="Unf","BsmtFinSF2"]=all_data.BsmtFinSF1.median()
all_data.BsmtUnfSF.fillna(0,inplace=True)
all_data.TotalBsmtSF.fillna(0,inplace=True)
all_data.BsmtFullBath.fillna(0, inplace=True)
all_data.BsmtHalfBath.fillna(0, inplace=True)'''
另外还有如Exterior1st 和 Exterior2nd 这样的属性,表示房子外墙的材料类型,如果有两种,
第二个才会有值,但是观察发现有很多第二个跟第一个是一样的,所以将第二个跟第一个一样的Exterior2nd
设为None, 同理Condition1和Condition2也是这样.
'''
all_data.loc[all_data["Exterior1st"]==all_data["Exterior2nd"],"Exterior2nd"]="None"
all_data.loc[all_data["Condition1"]==all_data["Condition2"],"Condition2"]="None"#Utilities 的取值单一,没有太大意义,故直接将其删除。
all_data.Utilities.value_counts()
all_data.drop('Utilities',axis=1, inplace=True)准备训练测试数据
删除不用特征
all_data.drop(["GarageArea","GarageYrBlt","MiscFeature","Fence","LotFrontage",
               "Street","SaleType","FullBath","1stFlrSF","MasVnrArea","MasVnrType"],
             axis=1,inplace=True)
添加新特征
添加了一个基于HouseStyle的特征,对于未完成的house转为数值0,已完成的为1
Unf=['2.5Unf','1.5Unf']
all_data["HouseStypeFinish"]=all_data["HouseStyle"].map(lambda x:0 if x in Unf else 1)all_data['TotalSF'] = all_data['TotalBsmtSF'] + all_data['BsmtFinSF1'] + all_data['BsmtFinSF2'] Category离散变量数值化
# Quality map
qual_dict = { 'NA':0,'Po':1,'Fa':2,'TA':3,'Gd':4,'Ex':5}
all_data["ExterQual"] = all_data["ExterQual"].map(qual_dict).astype(int)
all_data["ExterCond"] = all_data["ExterCond"].map(qual_dict).astype(int)
all_data["BsmtQual"] = all_data["BsmtQual"].map(qual_dict).astype(int)
all_data["BsmtCond"] = all_data["BsmtCond"].map(qual_dict).astype(int)
all_data["HeatingQC"] = all_data["HeatingQC"].map(qual_dict).astype(int)
all_data["KitchenQual"] = all_data["KitchenQual"].map(qual_dict).astype(int)
all_data["FireplaceQu"] = all_data["FireplaceQu"].map(qual_dict).astype(int)
all_data["GarageQual"] = all_data["GarageQual"].map(qual_dict).astype(int)
all_data["GarageCond"] = all_data["GarageCond"].map(qual_dict).astype(int)
all_data['PoolQC'] = all_data.PoolQC.replace({'NA':0,'Fa':1,'TA':2,'Gd':3,'Ex':4})
#basement finish type map dictionary
bsmt_fin_dict = {'NA': 0, "Unf": 1, "LwQ": 2, "Rec": 3, "BLQ": 4, "ALQ": 5, "GLQ": 6}
all_data["BsmtFinType1"] = all_data["BsmtFinType1"].map(bsmt_fin_dict).astype(int)
all_data["BsmtFinType2"] = all_data["BsmtFinType2"].map(bsmt_fin_dict).astype(int)
all_data['BsmtExposure'] = all_data.BsmtExposure.replace({'NA':0,'No':1,'Mn':2,'Av':3,'Gd':4})#other feature has obvious level category
#all_data['BsmtExposure'] = all_data.BsmtExposure.replace({'NA':0,'No':1,'Mn':2,'Av':3,'Gd':4})
all_data['CentralAir'] = all_data.CentralAir.replace({'N':0,'Y':1})
all_data['GarageFinish'] = all_data.GarageFinish.replace({'NA':0,'Unf':1,'Rfn':2,'Fin':3})
all_data['GarageType'] = all_data.GarageType.replace({'NA':0,'Detchd':1,'CarPort':2,
'BuiltIn':3,'Basment':4,'Attchd':5,
'2Types':6})
all_data['Alley'] = all_data.Alley.replace({'NA':0,'Pave':1,'Grvl':2})
all_data['GarageFinish'] = all_data.GarageFinish.replace({'NA':0,'Unf':1,'RFn':2,'Fin':3})#Neighborhood map
all_data['Neighborhood']=all_data['Neighborhood'].map(nei_dict).astype(int)# new or old house
all_data["Age"] = 2010 - all_data["YearBuilt"]
# if house is remodeled
all_data['Remolded'] = (all_data["YearRemodAdd"] != all_data["YearBuilt"]) * 1
# time since remodeled
all_data['AgeSinceRem'] = 2010-all_data['YearRemodAdd']
all_data['New'] = ((all_data["YearBuilt"] == all_data["YrSold"]))*1
all_data['New'] = ((all_data["YearRemodAdd"] == all_data["YrSold"]))*1def encode(frame, feature):
'''
对所有类型变量,依照各个类型变量的不同取值对应的样本集内房价的均值,按照房价均值高低
对此变量的当前取值确定其相对数值1,2,3,4等等,相当于对类型变量赋值使其成为连续变量。
注意:此函数会直接在原frame的DataFrame内创建新的一列来存放feature编码后的值。
'''
ordering = pd.DataFrame()
ordering['val'] = frame[feature].unique()
ordering.index = ordering.val
ordering['price_mean'] = frame[[feature, 'SalePrice']].groupby(feature).mean()['SalePrice']
# 上述 groupby()操作可以将某一feature下同一取值的数据整个到一起,结合mean()可以直接得到该特征不同取值的房价均值
ordering = ordering.sort_values('price_mean')
ordering['order'] = range(1, ordering.shape[0]+1)
ordering = ordering['order'].to_dict()
for attr_v, score in ordering.items():
# e.g. qualitative[2]: {'Grvl': 1, 'MISSING': 3, 'Pave': 2}
frame.loc[frame[feature] == attr_v, feature+'_E'] = score
category_encoded = []
# 由于category集合中包含了非数值型变量和伪数值型变量(多为评分、等级等,其取值为1,2,3,4等等)两类
# 因此只需要对非数值型变量进行encode()处理。
# 如果采用One-Hot编码,则整个qualitative的特征都要进行pd.get_dummies()处理
category_left = ['BldgType','Condition1','Condition2','Electrical','Exterior1st',
'Exterior2nd','Foundation','Functional','Heating','HouseStyle',
'LandContour','LandSlope','LotConfig','LotShape','MSZoning',
'PavedDrive','RoofMatl','RoofStyle','SaleCondition']
for q in category_left:
encode(all_data, q)
category_encoded.append(q+'_E')
all_data.drop(category_left, axis=1, inplace=True) # 离散变量已经有了编码后的新变量,因此删去原变量
print(category_encoded)
print(len(category_encoded))数值特征转为类别特征
all_data.YrSold = all_data.YrSold.astype(str)
all_data.MoSold = all_data.MoSold.astype(str)
all_data.MSSubClass = all_data.MSSubClass.astype(str)
all_data.HalfBath = all_data.HalfBath.astype(str)
all_data.BedroomAbvGr = all_data.BedroomAbvGr.astype(str)
#all_data.GarageCars = all_data.GarageCars.astype(str)
num_new = [f for f in all_data.columns if all_data.dtypes[f] != 'object']
category_new = [f for f in all_data.columns if all_data.dtypes[f] == 'object']
print(num_new)
print(category_new)
print(len(num_new))
print(len(category_new))#特征互相关分析与选取相关分析与选取
def spearman(frame, features):
'''
采用“斯皮尔曼等级相关”来计算变量与房价的相关性(可查阅百科)
此相关系数简单来说,可以对上述数值化处理后的等级变量及其它与房价的相关性进行更好的评价
(特别是对于非线性关系)
'''
spr = pd.DataFrame()
spr['feature'] = features
spr['corr'] = [frame[f].corr(frame['SalePrice'], 'spearman') for f in features]
spr = spr.sort_values('corr')
plt.figure(figsize=(6, 0.25*len(features)))
sns.barplot(data=spr, y='feature', x='corr', orient='h')
#features = num_data + category_encoded
spearman(all_data, num_new)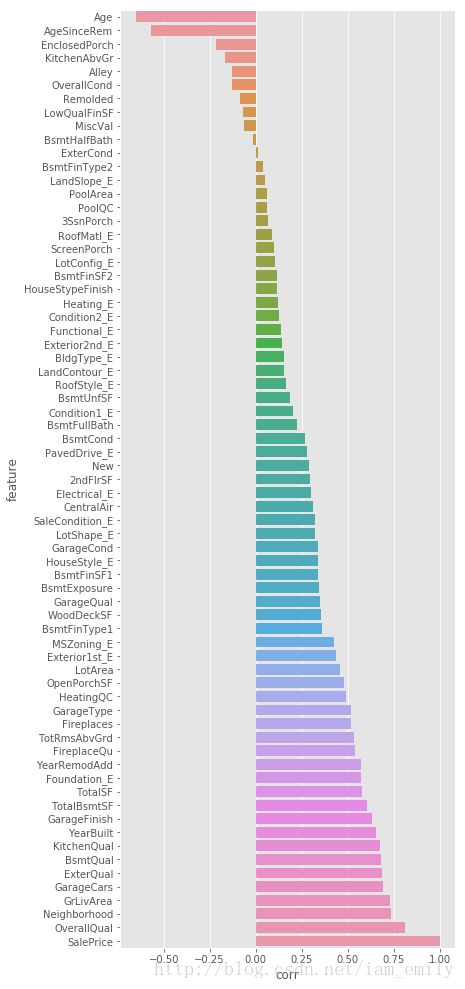
可以看出数值化后的特征影响符合现实表现,整体评价,地段,房屋面积等因素在前列,房屋年代是负相关。
对一些数值特征进行对数变换
from scipy.stats import skew
#log transform the target use log(1+x)
train["SalePrice"] = np.log1p(train["SalePrice"])
sns.distplot(train['SalePrice'])
print("Skewness: %f" % train['SalePrice'].skew())
print("Kurtosis: %f" % train['SalePrice'].kurt())
y = train.SalePrice
train_labels = y.values.copy
all_data.drop('SalePrice',axis=1,inplace=True)
Skewness: 0.121580
Kurtosis: 0.804751
#log transform skewed numeric features:
numeric_feats = all_data.dtypes[all_data.dtypes != "object"].index
from scipy.stats import skew

skewed_feats = all_data[numeric_feats].apply(lambda x: skew(x.dropna())) #compute skewness
skewed_feats = skewed_feats[skewed_feats > 0.75]
skewed_feats = skewed_feats.index

all_data[skewed_feats] = np.log1p(all_data[skewed_feats])
对新的类别特征进行one-hot编码使其数值化
# Create dummy features for categorical values via one-hot encoding
for col in category_new:
    for_dummy = all_data.pop(col)
    extra_data = pd.get_dummies(for_dummy,prefix=col)
    all_data = pd.concat([all_data, extra_data],axis=1)
标准化
注意对数据的标准化要用到所有数据中,包括训练集和测试集。
from sklearn.preprocessing import StandardScaler
N = StandardScaler()
scal_all_data = N.fit_transform(all_data)
from sklearn.model_selection import cross_val_score, train_test_split
print("New number of features : " + str(all_data.shape[1]))
train_all_data = scal_all_data[:train.shape[0]]
test_all_data = scal_all_data[train.shape[0]:]
print("train:" +str(train_all_data.shape))
print("test:" +str(test_all_data.shape))
print(len(y))
#test_all_data.tail()New number of features : 112
train:(1458, 112)
test:(1459, 112)
1458
生成训练集和测试集
X_train, X_test, y_train, y_test = train_test_split(train_all_data, y,test_size = 0.3, random_state=0)
print("X_train : " + str(X_train.shape))
print("X_test : " + str(X_test.shape))
print("y_train : " + str(y_train.shape))
print("y_test : " + str(y_test.shape))
训练模型
定义一个函数用以计算每个模型的交叉验证结果rmse,评判不同模型的效果
#对训练集和测试集分别进行交叉验证,得到error measure for official scoring : RMSE

from sklearn.linear_model import Ridge, RidgeCV, ElasticNet, LassoCV, LassoLarsCV
from sklearn.model_selection import cross_val_score
import xgboost
def rmse_cv(model):
    rmse= np.sqrt(-cross_val_score(model, X_train, y_train, scoring="neg_mean_squared_error", cv = 5))
    return(rmse)
def rmse_cv_test(model):
    rmse= np.sqrt(-cross_val_score(model, X_test, y_test, scoring="neg_mean_squared_error", cv = 5))
    return(rmse)
多项式回归
from sklearn.kernel_ridge import KernelRidge
KRR = KernelRidge(alpha=0.6, kernel='polynomial', degree=2, coef0=2.5)
score = rmse_cv(KRR)
score_test = rmse_cv_test(KRR)
print("Kernel Ridge score: {:.4f} ({:.4f})\n".format(score.mean(), score.std()))
print("Kernel Ridge score: {:.4f} ({:.4f})\n".format(score_test.mean(), score_test.std()))
Kernel Ridge score: 0.1189 (0.0108)
Kernel Ridge score: 0.1270 (0.0117)
岭回归Ridge
ridge = RidgeCV(alphas = [0.01, 0.03, 0.06, 0.1, 0.3, 0.6, 1, 3, 6, 10, 30, 60])
ridge.fit(X_train, y_train)
alpha = ridge.alpha_
print("Best alpha :", alpha)

print("Try again for more precision with alphas centered around " + str(alpha))
ridge = RidgeCV(alphas = [alpha * .5,alpha * .55,alpha * .6, alpha * .65, alpha * .7, alpha * .75, alpha * .8, alpha * .85,
                          alpha * .9, alpha * .95, alpha, alpha * 1.05, alpha * 1.1, alpha * 1.15,
                          alpha * 1.25, alpha * 1.3, alpha * 1.35, alpha * 1.4],
                cv = 10)
ridge.fit(X_train, y_train)
alpha = ridge.alpha_
print("Best alpha :", alpha)
print("Ridge RMSE on Training set :", rmse_cv(ridge).mean())
print("Ridge RMSE on Test set :", rmse_cv_test(ridge).mean())
Best alpha : 30.0
Try again for more precision with alphas centered around 30.0
Best alpha : 27.0
Ridge RMSE on Training set : 0.118370003199
Ridge RMSE on Test set : 0.126548632298
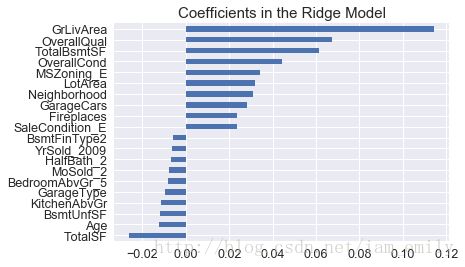
# Plot important coefficients
coefs = pd.Series(ridge.coef_, index = all_data.columns)
print("Ridge picked " + str(sum(coefs != 0)) + " features and eliminated the other " +  \
      str(sum(coefs == 0)) + " features")
imp_coefs = pd.concat([coefs.sort_values().head(10),
                     coefs.sort_values().tail(10)])
imp_coefs.plot(kind = "barh")
plt.title("Coefficients in the Ridge Model")
plt.show()
Ridge picked 112 features and eliminated the other 0 features
lasso model
#lasso = LassoCV(alphas = [0.0001, 0.0003, 0.0006, 0.001, 0.003, 0.006, 0.01, 0.03, 0.06, 0.1,
#                         0.3, 0.6, 1],
#                max_iter = 50000, cv = 10)
lasso = LassoCV(alphas = [1, 0.1, 0.001, 0.0005])
lasso.fit(X_train, y_train)
alpha = lasso.alpha_
print("Best alpha :", alpha)

print("Try again for more precision with alphas centered around " + str(alpha))
lasso = LassoCV(alphas = [alpha * .6, alpha * .65, alpha * .7, alpha * .75, alpha * .8,
                          alpha * .85, alpha * .9, alpha * .95, alpha, alpha * 1.05,
                          alpha * 1.1, alpha * 1.15, alpha * 1.25, alpha * 1.3, alpha * 1.35,
                          alpha * 1.4],
                max_iter = 50000, cv = 10)
lasso.fit(X_train, y_train)
alpha = lasso.alpha_
print("Best alpha :", alpha)

print("Lasso RMSE on Training set :", rmse_cv(lasso).mean())
print("Lasso RMSE on Test set :", rmse_cv_test(lasso).mean())
Best alpha : 0.001
Try again for more precision with alphas centered around 0.001
Best alpha : 0.0014
Lasso RMSE on Training set : 0.115958983923
Lasso RMSE on Test set : 0.123666217616
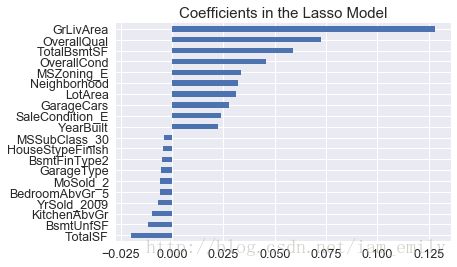
# Plot important coefficients
coefs = pd.Series(lasso.coef_, index = all_data.columns)
print("Lasso picked " + str(sum(coefs != 0)) + " features and eliminated the other " +  \
      str(sum(coefs == 0)) + " features")
imp_coefs = pd.concat([coefs.sort_values().head(10),
                     coefs.sort_values().tail(10)])
imp_coefs.plot(kind = "barh")
plt.title("Coefficients in the Lasso Model")
plt.show()
Lasso picked 80 features and eliminated the other 32 features
ElasticNet Model
from sklearn.linear_model import ElasticNetCV
elasticNet = ElasticNetCV(l1_ratio = [0.1, 0.3, 0.5, 0.6, 0.7, 0.8, 0.85, 0.9, 0.95, 1],
                          alphas = [0.0001, 0.0003, 0.0006, 0.001, 0.003, 0.006,
                                    0.01, 0.03, 0.06, 0.1, 0.3, 0.6, 1, 3, 6],
                          max_iter = 50000, cv = 10)
elasticNet.fit(X_train, y_train)
alpha = elasticNet.alpha_
ratio = elasticNet.l1_ratio_
print("Best l1_ratio :", ratio)
print("Best alpha :", alpha )

print("Try again for more precision with l1_ratio centered around " + str(ratio))
elasticNet = ElasticNetCV(l1_ratio = [ratio * .85, ratio * .9, ratio * .95, ratio, ratio * 1.05, ratio * 1.1, ratio * 1.15],
                          alphas = [0.0001, 0.0003, 0.0006, 0.001, 0.003, 0.006, 0.01, 0.03, 0.06, 0.1, 0.3, 0.6, 1, 3, 6],
                          max_iter = 50000, cv = 10)
elasticNet.fit(X_train, y_train)
if (elasticNet.l1_ratio_ > 1):
    elasticNet.l1_ratio_ = 1
alpha = elasticNet.alpha_
ratio = elasticNet.l1_ratio_
print("Best l1_ratio :", ratio)
print("Best alpha :", alpha )

print("Now try again for more precision on alpha, with l1_ratio fixed at " + str(ratio) +
      " and alpha centered around " + str(alpha))
elasticNet = ElasticNetCV(l1_ratio = ratio,
                          alphas = [alpha * .6, alpha * .65, alpha * .7, alpha * .75, alpha * .8, alpha * .85, alpha * .9,
                                    alpha * .95, alpha, alpha * 1.05, alpha * 1.1, alpha * 1.15, alpha * 1.25, alpha * 1.3,
                                    alpha * 1.35, alpha * 1.4],
                          max_iter = 50000, cv = 10)
elasticNet.fit(X_train, y_train)
if (elasticNet.l1_ratio_ > 1):
    elasticNet.l1_ratio_ = 1
alpha = elasticNet.alpha_
ratio = elasticNet.l1_ratio_
print("Best l1_ratio :", ratio)
print("Best alpha :", alpha )

print("ElasticNet RMSE on Training set :", rmse_cv(elasticNet).mean())
print("ElasticNet RMSE on Test set :", rmse_cv_test(elasticNet).mean())
Best l1_ratio : 0.5
Best alpha : 0.003
Try again for more precision with l1_ratio centered around 0.5
Best l1_ratio : 0.475
Best alpha : 0.003
Now try again for more precision on alpha, with l1_ratio fixed at 0.475 and alpha centered around 0.003
Best l1_ratio : 0.475
Best alpha : 0.003
ElasticNet RMSE on Training set : 0.116031335159
ElasticNet RMSE on Test set : 0.12208609128
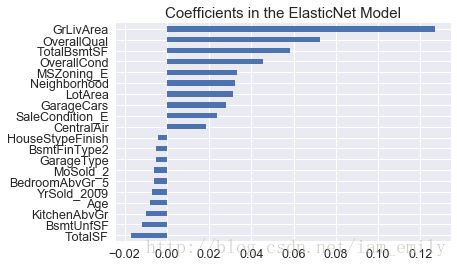
coefs = pd.Series(elasticNet.coef_, index = all_data.columns)
print("ElasticNet picked " + str(sum(coefs != 0)) + " features and eliminated the other " +  str(sum(coefs == 0)) + " features")
imp_coefs = pd.concat([coefs.sort_values().head(10),
                     coefs.sort_values().tail(10)])
imp_coefs.plot(kind = "barh")
plt.title("Coefficients in the ElasticNet Model")
plt.show()
ElasticNet picked 80 features and eliminated the other 32 features
Xgboost
xgboost的参数是从网上找的,对运行时间影响较大
from xgboost import XGBRegressor
'''
xgb = XGBRegressor(colsample_bytree=0.4603, gamma=0.0468,
                             learning_rate=0.05, max_depth=3,
                             min_child_weight=1.7817, n_estimators=2200,
                             reg_alpha=0.4640, reg_lambda=0.8571,
                             subsample=0.5213, silent=1,
                             random_state =7, nthread = -1)
'''
xgb = XGBRegressor(n_estimators=700,learning_rate=0.07,subsample=0.9,colsample_bytree=0.7)
print('Xgboodt RMSE on training data:',rmse_cv(xgb).mean())
print('Xgboost RMSE on test data:',rmse_cv_test(xgb).mean())
Xgboodt RMSE on training data: 0.12726105661
Xgboost RMSE on test data: 0.126590562523
GradientBoost
from sklearn.ensemble import GradientBoostingRegressor
gbr = GradientBoostingRegressor(n_estimators=3000, learning_rate=0.05,
                                max_depth=4, max_features='sqrt',
                                min_samples_leaf=15, min_samples_split=10,
                                loss='huber', random_state =5)
print('GradientBoost RMSE on training data:',rmse_cv(gbr).mean())
print('GradientBoost RMSE on test data:',rmse_cv_test(gbr).mean())
GradientBoost RMSE on training data: 0.125016856097
GradientBoost RMSE on test data: 0.127225404959
虽然elasticNet和Lasso模型在训练集上表现较好,但容易过拟合,受数据影响较大,xgboost等集成算法具有很稳定的表现。对各个模型进行加权求和。
Ensemble
from sklearn.base import BaseEstimator, TransformerMixin, RegressorMixin,clone
from sklearn.model_selection import KFold
class AveragingModels(BaseEstimator, RegressorMixin, TransformerMixin):
    def __init__(self, models,weights):
        self.models = models
        self.weights = np.array(weights)
    def fit(self, X, y):
        self.models_ = [clone(x) for x in self.models]
        for model in self.models_:
             model.fit(X,y)
        return self
    def predict(self,X):
        predictions = np.column_stack([model.predict(X) for model in self.models_])
        return np.sum(self.weights*predictions, axis=1)
#aver_model = AveragingModels(models=(elasticNet,KRR,ridge,lasso),weights=(0.5,0.1,0.25,0.15))
#aver_model = AveragingModels(models=(elasticNet,xgb,ridge,lasso),weights=(0.5,0.1,0.25,0.15))
aver_model = AveragingModels(models=(xgb,gbr,elasticNet,ridge,lasso),weights=(0.6,0.1,0.2,0.05,0.05))
print('aver model on train:',rmse_cv(aver_model).mean())
print('aver model on test:',rmse_cv_test(aver_model).mean()) aver model on train: 0.118569419587
aver model on test: 0.119069294424
对xgboost赋予较高的权重,elasticnet和lasso表现相近,对elasticnet较高权重后lasso可相对较小。
#pred_y_log = elasticNet.predict(test_all_data)
aver_model.fit(train_all_data,y)
pred_y_log = aver_model.predict(test_all_data)
pred_y = np.expm1(pred_y_log)
参考资料:
- 1.A study on Regression applied to the Ames dataset(by juliencs)https://www.kaggle.com/juliencs/a-study-on-regression-applied-to-the-ames-dataset/notebook
- 2.Comprehensive data exploration with Python(by Pedro Marcelino)https://www.kaggle.com/pmarcelino/comprehensive-data-exploration-with-python/notebook
- 3.House Price EDA(by Dominik Gawlik)https://www.kaggle.com/dgawlik/house-prices-eda
- 4.Stacked Regressions : Top 4% on LeaderBoard(by Serigne)https://www.kaggle.com/serigne/stacked-regressions-top-4-on-leaderboard/notebook
- 5.XGBoost + Lasso(by Human Analog)https://www.kaggle.com/humananalog/xgboost-lasso/comments
