目录
一、 matplotlib安装
1、安装matplotlib
2、import matplotlib
3、最简单的例子
二、基本使用
1、Legends, Titles, and Labels图例、标题和坐标名称
2、Bar Charts 条形图
3、Histograms 直方图
4、Scatter Plots 散点图
5、Stack Plots 堆叠图
6、Pie Charts 饼图
三、结束语
一、matplotlib安装
1. 安装matplotlib
在cmd输入:pip install matplotlib 如果上面的语句不行,则改为:C:/Python34/Scripts/pip install matplotlib (34是python版本)
2. import matplotlib
import matplotlib.pyplot as plt
3. 最简单的例子
plt.plot([1,2,3],[5,7,4]) plt.show()
二、基本使用
1、Legends, Titles, and Labels图例、标题和坐标名称
import matplotlib.pyplot as plt
x = [1,2,3]
y = [5,7,4]
x2 = [1,2,3]
y2 = [10,14,12]
plt.plot(x, y, label='First Line')
plt.plot(x2, y2, label='Second Line')
plt.xlabel('Plot Number')
plt.ylabel('Important var')
plt.title('Interesting Graph\nSubtitle') #\n是换行符,换行加个subtitle
plt.legend() # 显示图例
plt.show()
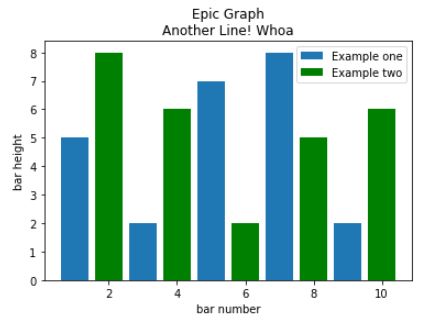
2、Bar charts条形图
import matplotlib.pyplot as plt
plt.bar([1,3,5,7,9],[5,2,7,8,2], label="Example one")
plt.bar([2,4,6,8,10],[8,6,2,5,6], label="Example two", color='g')
plt.legend()
plt.xlabel('bar number')
plt.ylabel('bar height')
plt.title('Epic Graph\nAnother Line! Whoa')
plt.show()
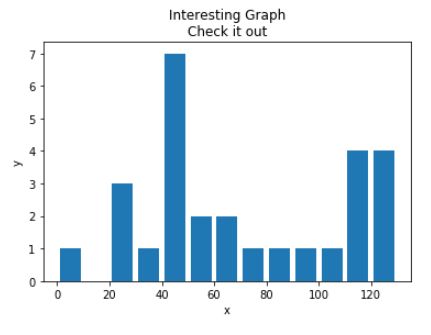
3、Histograms 直方图
直方图跟条形图很像,但是直方图一般是用来展现数据分布的。
import matplotlib.pyplot as plt
population_ages = [22,55,62,45,21,22,34,42,42,4,99,102,110,120,121,122,130,111,115,112,80,75,65,54,44,43,42,48]
bins = [0,10,20,30,40,50,60,70,80,90,100,110,120,130]
plt.hist(population_ages, bins, histtype='bar', rwidth=0.8)
plt.xlabel('x')
plt.ylabel('y')
plt.title('Interesting Graph\nCheck it out')
#plt.legend()
plt.show()
4、Scatter Plots 散点图
import matplotlib.pyplot as plt
x = [1,2,3,4,5,6,7,8]
y = [5,2,4,2,1,4,5,2]
plt.scatter(x,y, label='skitscat', color='k', s=25, marker="o") # s is the maker size
plt.xlabel('x')
plt.ylabel('y')
plt.title('Interesting Graph\nCheck it out')
plt.legend()
plt.show()
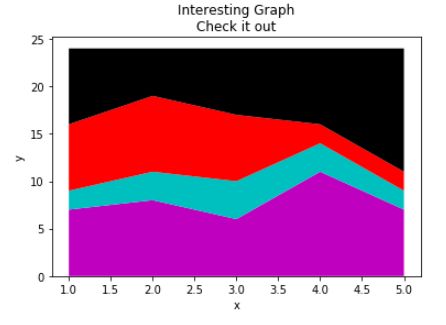
5、Stack Plots堆叠图
import matplotlib.pyplot as plt
days = [1,2,3,4,5]
sleeping = [7,8,6,11,7]
eating = [2,3,4,3,2]
working = [7,8,7,2,2]
playing = [8,5,7,8,13]
plt.stackplot(days, sleeping, eating, working, playing, colors=['m','c','r','k'])
plt.xlabel('x')
plt.ylabel('y')
plt.title('Interesting Graph\nCheck it out')
plt.show()
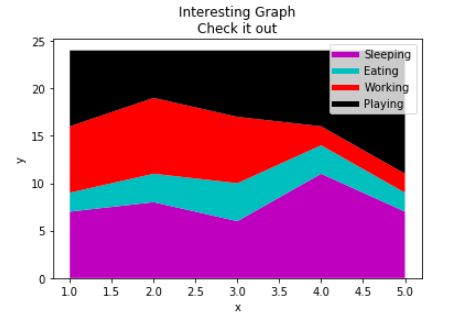
从这个图可以基本看出我们的时间是怎么花的,但是问题是,如果不看代码,我们很难看出哪个颜色对应哪个活动。下一个问题是,对于多边形,我们无法真正给各部分打上标签,但是我们还有别的方法:
import matplotlib.pyplot as plt
days = [1,2,3,4,5]
sleeping = [7,8,6,11,7]
eating = [2,3,4,3,2]
working = [7,8,7,2,2]
playing = [8,5,7,8,13]
# 先把图例给画出来
plt.plot([],[],color='m', label='Sleeping', linewidth=5)
plt.plot([],[],color='c', label='Eating', linewidth=5)
plt.plot([],[],color='r', label='Working', linewidth=5)
plt.plot([],[],color='k', label='Playing', linewidth=5)
plt.stackplot(days, sleeping, eating, working, playing, colors=['m','c','r','k'])
plt.xlabel('x')
plt.ylabel('y')
plt.title('Interesting Graph\nCheck it out')
plt.legend()
plt.show()
好,这就清晰多了。
6、Pie Charts饼图
import matplotlib.pyplot as plt
slices = [7,2,2,13]
activities = ['sleeping','eating','working','playing']
cols = ['c','m','r','b']
plt.pie(slices,
labels=activities,
colors=cols,
startangle=90,
shadow= True,
explode=(0,0.1,0,0), # explode the second one eating to draw attention
autopct='%1.1f%%') # adds percentage
plt.title('Interesting Graph\nCheck it out')
plt.show()
三、结束语
我只是个搬运工,以上内容来自Youtube Matplotlib Tutorial Series - Graphing in Python https://www.youtube.com/playlist?list=PLQVvvaa0QuDfefDfXb9Yf0la1fPDKluPF,关于matplotlib的一个很好的学习教程,有兴趣的话可以直接观看视频(kexueshangwang)。


