Pandas 常用指令汇总
Pandas
总结
-
导入数据 & 帮助菜单
- 导入数据 df = pd.read_csv(’./data/titanic.csv’)
- 打开帮助菜单 print(help(pd.read_csv))
-
读取:
- df.head(6) #显示开头6行
- df.info() #.info返回当前的信息 查找缺失值
-
查看列表情况:
- df.index #查看索引
- df.columns
- df.dtypes #查看类型
- df.values ##显示数组结构
-
创建dataframe 结构
#建立字典结构
data = {‘country’:[‘aaa’,‘bbb’,‘ccc’],
‘population’:[10,12,14]}
df_data = pd.DataFrame(data) -
取指定数据
#令age等于‘Age’列,显示‘Age’列前5条
age = df[‘Age’]
age[:5] -
索引
1) 指定索引列:df = df.set_index(‘Name’)
2) loc 用label来去定位: df.loc[‘Heikkinen, Miss. Laina’]
3) iloc 用position来去定位: df.iloc[0:5,1:3]
4) Bool索引 -
Groupby
- df.groupby(‘key’).sum()
- 均值: df.groupby(‘key’).aggregate(np.mean)
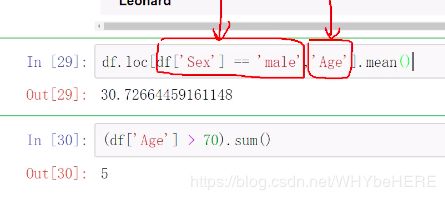
- 统计不同性别的年龄:df.groupby(‘Sex’)[‘Age’].mean()
-
计算&排序
- 计算:
1) df.cov()
2) df.corr() - 计数排序:
df[‘Age’].value_counts()
df[‘Age’].value_counts(ascending = True)
df[‘Pclass’].value_counts(ascending = True)
df[‘Age’].value_counts(ascending = True,bins = 5) #分组
- 计算:
-
对象操作
- replace/rename/append
- 合并
- res = pd.merge(left, right, on = ‘key’)
- res = pd.merge(left, right, on = [‘key1’, ‘key2’])
只传共有的key,没有的默认删掉 - res = pd.merge(left, right, on = [‘key1’, ‘key2’], how = ‘outer’)
所有可能性列出来,缺失值nan - res = pd.merge(left, right, on = [‘key1’, ‘key2’], how = ‘outer’, indicator = True)
- 加多一列显示,是那个表格有的还是共有的
指定只要左边或右边的
res = pd.merge(left, right, how = ‘left’)
res = pd.merge(left, right, how = ‘right’)
-
数据透视表
-
时间操作
其他:
data.drop_duplicates()
具体例子
1. 导入数据 & 帮助菜单
导入CSV文件
df = pd.read_csv('./data/titanic.csv')
#打开帮助菜单
print(help(pd.read_csv))
sep : str, default ‘,’
≈读取
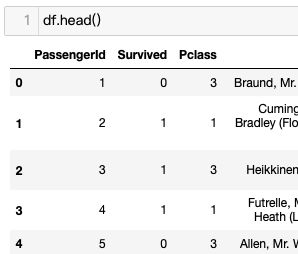
df.head(6) #显示开头6行
df.info() #.info返回当前的信息 查找缺失值
<class 'pandas.core.frame.DataFrame'>
RangeIndex: 891 entries, 0 to 890
Data columns (total 12 columns):
PassengerId    891 non-null int64
Survived       891 non-null int64
Pclass         891 non-null int64
Name           891 non-null object
Sex            891 non-null object
Age            714 non-null float64  #有缺失值
SibSp          891 non-null int64
Parch          891 non-null int64
Ticket         891 non-null object
Fare           891 non-null float64
Cabin          204 non-null object
Embarked       889 non-null object
dtypes: float64(2), int64(5), object(5)
memory usage: 83.6+ KB  #内存
3.列表情况
df.index
df.columns
df.dtypes

df.values ##数组结构
array([[1, 0, 3, ..., 7.25, nan, 'S'],
       [2, 1, 1, ..., 71.2833, 'C85', 'C'],
       [3, 1, 3, ..., 7.925, nan, 'S'],
       ...,
       [889, 0, 3, ..., 23.45, nan, 'S'],
       [890, 1, 1, ..., 30.0, 'C148', 'C'],
       [891, 0, 3, ..., 7.75, nan, 'Q']], dtype=object)
4.创建dataframe 结构
#建立字典结构
data = {'country':['aaa','bbb','ccc'],
       'population':[10,12,14]}
df_data = pd.DataFrame(data)
df_data
5.取指定数据
#令age等于‘Age’列,显示‘Age’列前5条
age = df['Age']
age[:5]
0    22.0
1    38.0
2    26.0
3    35.0
4    35.0
Name: Age, dtype: float64

# age有自己单独索引和值
age.index
RangeIndex(start=0, stop=891, step=1)

age.values[:5]
array([ 22.,  38.,  26.,  35.,  35.])
6. 索引
1)指定索引列
#指定索引列
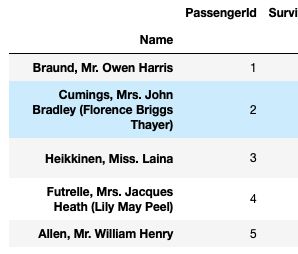
df = df.set_index('Name')
df.head()
2&3) loc iloc
#loc 用label来去定位:
df.loc['Heikkinen, Miss. Laina']
#iloc 用position来去定位:
df.iloc[0:5,1:3]
4)Bool索引
df[输入判断语句]
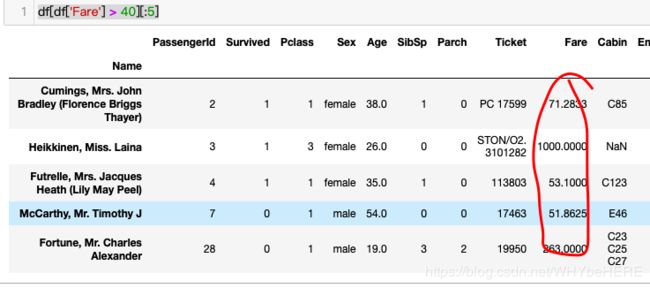
df[df[‘Fare’] > 40]
找出Fare大于40的:
df['Fare'] > 40 # 判断返回T/F
df[df['Fare'] > 40][:5] #回传到df,
7. Groupby
df = pd.DataFrame({'key':['A','B','C','A','B','C','A','B','C'],
                  'data':[0,5,10,5,10,15,10,15,20]})

df.groupby('key').sum()

计算均值: df.groupby(‘key’).aggregate(np.mean)
统计不同性别的年龄:df.groupby(‘Sex’)[‘Age’].mean()

8. 计算:二元统计&排序
df.cov()
df.corr()

计数排序:
df['Age'].value_counts()
df['Age'].value_counts(ascending = True)
df['Pclass'].value_counts(ascending = True)
df['Age'].value_counts(ascending = True,bins = 5) #分组
9. 对象操作
Series结构的增删改查
data = [10,11,12]
index = ['a','b','c']
s = pd.Series(data = data,index = index)

a    10
b    11
c    12
dtype: int64
查操作
s[0]
10

s[0:2]
a    10
b    11
dtype: int64

mask = [True,False,True]
s[mask]
a    10
c    12
dtype: int64

s.loc['b']
11
改操作
#将100换成101
s1.replace(to_replace = 100,value = 101,inplace = True)
#直接操作修改index
s1.index = ['a','b','d']
#将index‘a'换成‘A’
s1.rename(index = {'a':'A'},inplace = True)
增操作
s3 = s1.append(s2)

s1.append(s2,ignore_index = True)
删操作
del s1['A']
s1.drop(['b','d'],inplace = True)
10.合并
res = pd.merge(left, right)
res = pd.merge(left, right, on = ‘key’)
res = pd.merge(left, right, on = [‘key1’, ‘key2’])
只传共有的key,没有的默认删掉
res = pd.merge(left, right, on = [‘key1’, ‘key2’], how = ‘outer’)
所有可能性列出来,缺失值nan
res = pd.merge(left, right, on = [‘key1’, ‘key2’], how = ‘outer’, indicator = True)
加多一列显示,是那个表格有的还是共有的
指定只要左边或右边的
res = pd.merge(left, right, how = ‘left’)
res = pd.merge(left, right, how = ‘right’)
11 . 数据透视表
12.时间操作
dt = datetime.datetime(year=2017,month=11,day=24,hour=10,minute=30)
ts = pd.Timestamp('2017-11-24')
ts.month
ts.day
ts + pd.Timedelta('5 days')
pd.to_datetime('2017-11-24')
pd.to_datetime('24/11/2017')
时间序列
s = pd.Series(['2017-11-24 00:00:00','2017-11-25 00:00:00','2017-11-26 00:00:00'])
#构建时间序列
pd.Series(pd.date_range(start='2017-11-24',periods = 10,freq = '12H'))
##指定时间段
data[pd.Timestamp('2012-01-01 09:00'):pd.Timestamp('2012-01-01 19:00')]
data[('2012-01-01 09:00'):('2012-01-01 19:00')]
data['2013']
data['2012-01':'2012-03']
#只取1月的
data[data.index.month == 1]
data[(data.index.hour > 8) & (data.index.hour <12)]
data.between_time('08:00','12:00')
#重采样
data.resample('D',how='mean').head()
data.resample('D').max().head()
data.resample('3D').mean().head() #三天
data.resample('M').mean().head() #月均


