python.matplotlib/random.choice学习范例-随机生成点图
from random import choice
class RandomWark():
'''生成一个随机漫步数据的类'''
def __init__(self,num_points=5000):
'''初始化属性'''
self.num_points=num_points
#所有随机漫步开始于(0,0)
self.x_values=[0]
self.y_values=[0]
def fill_walk(self):
'''计算所有的点'''
#不断漫步,直到列表达到指定的长度
while len(self.x_values)
#x,y的前进方向以及沿这个方向的距离
x_direction=choice([1,-1])
x_distance=choice([0,1,2,3,4])
x_step=x_direction * x_distance
y_direction=choice([1,-1])
y_distance=choice([0,1,2,3,4])
y_step=y_direction * y_distance
#拒绝原地踏步
if x_step == 0 and y_step == 0:
continue
#计算下一个点的x和y值
next_x=self.x_values[-1]+x_step
next_y=self.y_values[-1]+y_step
self.x_values.append(next_x)
self.y_values.append(next_y)
import matplotlib.pyplot as plt
#多次随机漫步,只要程序处于活跃状态就不断模拟
while True:
#创建一个实例,并绘制点
rw=RandomWark()
rw.fill_walk()
#调整尺寸适应屏幕
plt.figure(dpi=128,figsize=(10,6))
#设置每个漫步点的颜色
point_numbers=list(range(rw.num_points))
plt.scatter(rw.x_values,rw.y_values,c=point_numbers,cmap=plt.cm.Blues,
edgecolor='none',s=15)
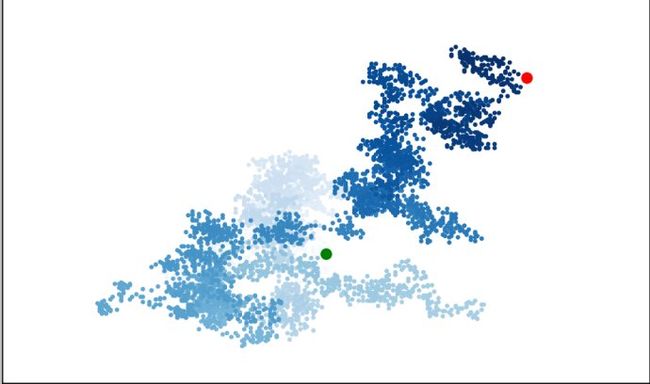
#标记起点和终点
plt.scatter(0,0,c='green',edgecolor='none',s=100)
plt.scatter(rw.x_values[-1],rw.y_values[-1],c='red',edgecolor='none',s=100)
#隐藏坐标轴
plt.axes().get_xaxis().set_visible(False)
plt.axes().get_yaxis().set_visible(False)
plt.show()
#判断进程
keep_running=input("make another walk?(y/n): ")
if keep_running == 'n':
break