Quick Tip: Using Web Inspector to Debug Mobile Safari
试了一下,自己应用里面,嵌入的webview 也可以用,模拟器可以用,真机可以用,只能说很好用了。
Tutorial Details
- Topic: Web Development
- Difficulty: Beginner
- Additional requirements: Hardware: Mac, iDevice (optional), USB cable. Software: Lion OS or higher, Safari 6, Xcode 4.5 with iOS6 SDK (optional)
Building and debugging websites and web applications for mobile devices can be a hassle. On the desktop we have powerful debugging tools; most browsers have a web inspector of some kind. But we don’t have those tools for devices like the iPhone and iPad … that is, until now!
With the recent release of Safari 6 and iOS 6, you can now use web inspector to build and debug websites on the desktop and on mobile Safari. Best of all? It’s a simple process to setup. Follow this tutorial and you’ll have some powerful debugging tools for mobile iDevices at your fingertips in no time.
Modern browser developer tools have been an immense help in building websites and web applications. Chrome has developer tools. Firefox? Firebug. Safari? Web inspector. All extremely powerful tools in web development.
Be that as it may, up to this point debugging websites and web applications on mobile devices has been a hassle. As Safari and Chrome both run on the webkit engine, there are many similarities in the way the desktop and mobile browser render a web layout. Thus, most designers/developers build and tweak their websites on the desktop using one of these browers, assuming the similarities resulting from the webkit engine will render the page equally the same on a mobile device.
However, mobile and desktop platforms are acutally quite different. They have different memory capacities, performance potential, input devices, and network connectivity. So it has become imperative that a designer’s debugging tools for mobile devices become more performant and match those of their desktop counterparts.
Apple’s new software releases of iOS 6 and Safari 6 bring many of the features of desktop browser debugging tools we all know and love to mobile devices. This tutorial will show you the simple process of getting setup to debug mobile websites using Safari’s web inspector.
Before we start, a note on compatibility: There’s a bit of bad news for those using Windows. You can only debug using the remote web inspector on a Mac. Safari 6 for windows is not available. Also, Safari 6 is only available for Macs running OSX Lion or higher.
Methods for Using Web Inspector
There are two methods for using web inspector in mobile Safari:
- Real Device Method: Use a real iDevice (iPhone, iPad, etc) connected to your computer via USB
- Virtual Device Method: Use the iOS simulator, which is part of Xcode
We’ll cover both of these methods and let you choose which one suits your situation best.
Step 1: Ensure You’re Up to Date
Because debugging mobile devices with web inspector is a new feature, you’ll have to make sure you have all the latest software.
Real Device Method: To use web inspector in tandem with a real iDevice, you’ll need the following:
- An iDevice (iPhone, iPad, iTouch) running iOS 6
- USB Cable
- Safari 6
- Mac OSX Lion (10.7.4) or higher
Virtual Device Method: To use web inspector in tandem with iOS simulator, you’ll need the following:
- Safari 6
- Mac OSX Lion (10.7.4) or higher
- Xcode 4.5 with iOS 6 SDK (available in the app store)
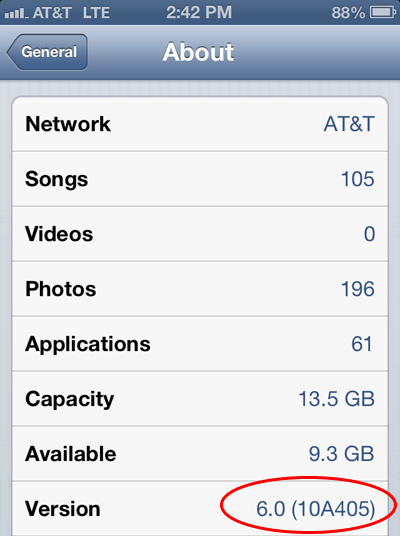
Checking Software versions: To check if you’re running iOS 6 on your iDevice, go to “Settings > General > About” on your device.
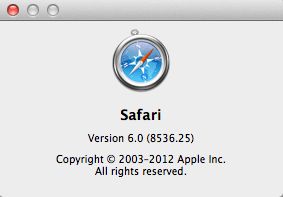
To check if you’re running Safari 6 go to Safari’s menubar and click “Safari > About Safari”.
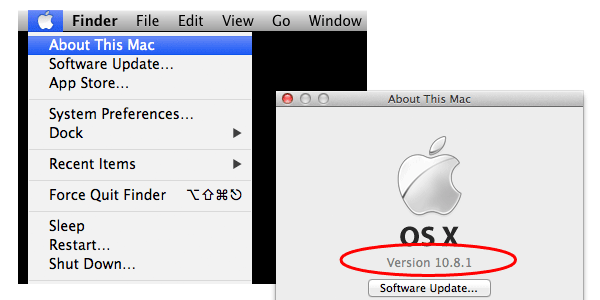
To ensure you’re running Lion, click on the Apple logo in the menu bar and choose “About this Mac”
To ensure you’re running the correct version of Xcode, open Xcode and choose “Xcode > About Xcode”
Step 2: Turn on Developer Tools
You must enable the developer tools and web inspector in the desktop and mobile versions of Safari.
Real Device Method: If you’re going to use a real device, connect it to your mac via USB.
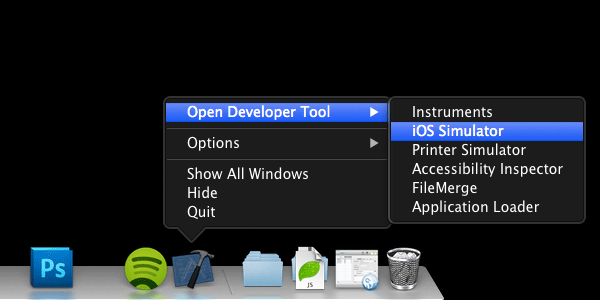
Virtual Device Method: If you’re going to use iOS simulator, open Xcode, then right-click on the dock icon and choose “Open Developer Tool > iOS Simulator”.
Mobile Safari: On your real iDevice or in iOS simulator go to “Settings > Safari > Advanced” and turn on “Web Inspector”.
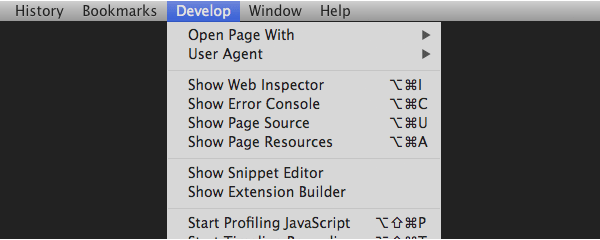
Desktop Safari: If you don’t already, ensure you have developer tools in Safari turned on. You’ll know you have them turned on if you can see “Develop” in the menu bar.
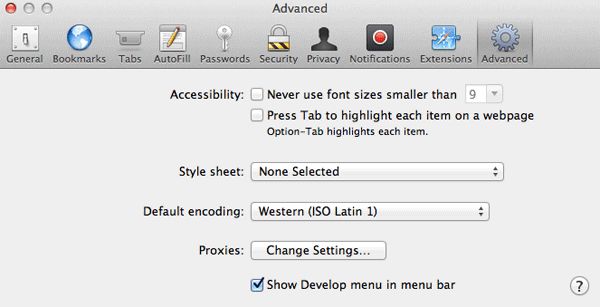
If you can’t see “Develop” in the menu bar, go to the menu bar and click “Safari > Preferences > Advanced” and select the “Show develop menu in menu bar” checkbox.
Step 3: Inspect Your Website
Now that you have either iOS Simulator open or your iDevice connected to your mac via USB (or both!), you’re ready to start using web inspector on your website.
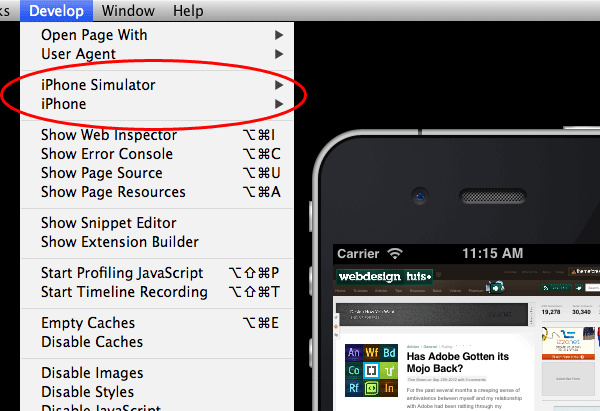
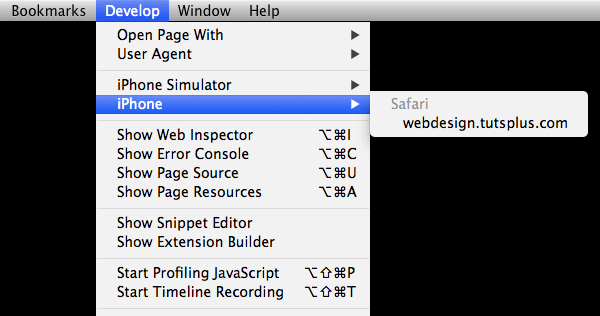
On your mac, open Safari and go to “Develop”. You should now see any iDevices (virtual or real) that you have connected and running with your mac. In the screenshot below, you’ll see I have two devices in the menu: one is the iOS simulator, the other is a real iPhone connected to my mac.
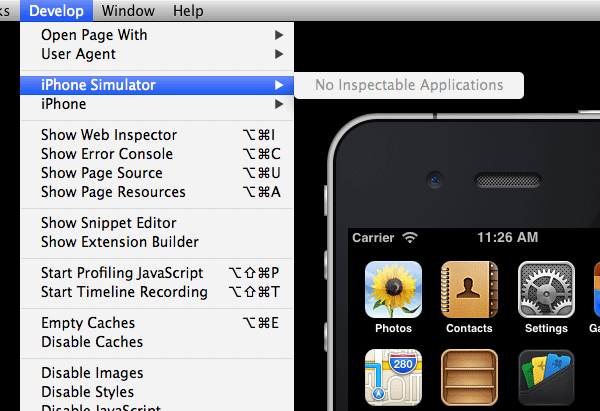
In order to actually begin inspecting a website, you have to have mobile Safari launched on the device and have one of the tabs open to the website. If you don’t have mobile Safari open, you’ll see a message stating “No Inspectable Applications”.
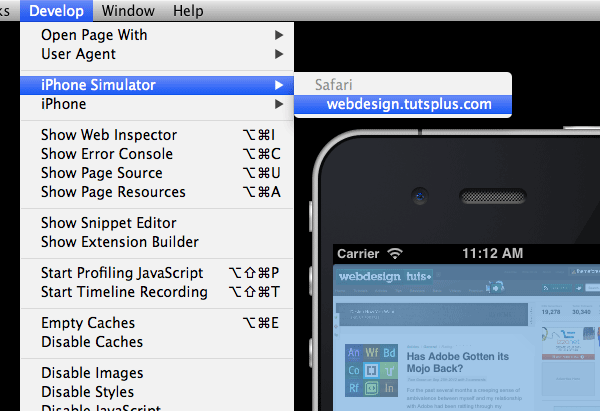
To begin inspecting, simply enter the URL of the page you want to inspect in mobile Safari and then choose that site from the “Develop” menu. You can begin inspecting sites on your real iDevice or from iOS simulator. When you select the page, you’ll see a blue overlay on the page, indicating which one you’ve selected.
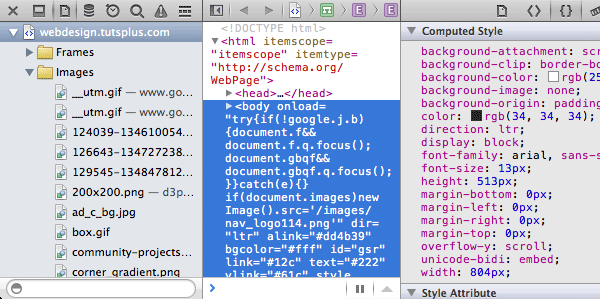
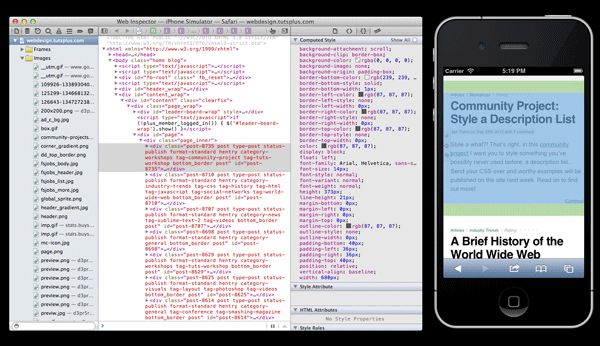
By choosing a site, Safari’s web inspector will open up and allow you to begin inspecting your website. That’s it!
Conclusion
Now that you have Safari’s web inspector at your fingertips, you have much more control in building and debugging websites and web applications.
Here’s a sample of some things you can now do when debugging mobile sites:
- Make live changes to HTML and CSS.
- See how your website/application is performing including seeing details for JavaScript events and network requests.
- Debug JavaScript using breakpoints and other tools.
- View warnings and errors.
- Access the console.
- Search the DOM.
- Access and view site storage.
You have the tools, go forth and build!
