Hourse Prices预测
一,数据预处理
读取数据:
train <- read.csv('...\\train.csv',stringsAsFactors = T)
test <- read.csv('...\\test.csv',stringsAsFactors = T)
head(train,5)
将训练集与验证集合并为同一个表格,方便进行数据预处理;
test$SalePrice <- NA
data <- rbind(train,test) #bind_rows(train,test)会将部分变量转换成char类型
train.row <- 1:nrow(train)
test.row <- (1+nrow(train)):(nrow(train)+nrow(test))
查看数据整体情况
str(data)
table(sapply(data, class ))
数据缺失情况展示图
library(VIM)
matrixplot(data)
缺失数据汇总统计
temp <- sapply(data, function(x)  sum(is.na(x)) )
miss <- sort(temp, decreasing=T)
miss[miss>0]
显示数据缺失比例
miss1 <- miss / 2919
miss1[miss1>0]
将训练数据集分为数值型变量与因子型变量两部分,后续会分别进行处理
a <- vector(mode="numeric",length=0)
for (i in 1:ncol(train)){
    if (is.numeric(train[[i]]) == 1){
        a[i] <- names(train)[i]
    } else{
        a[i] <- "None"}
}
aa <- a[a != "None"]
bb <- names(train)[names(train) %in% a == F]
qualiVar <- train[aa][-1]
typeVar <- train[bb]
针对数值型变量进行预处理,逐个考察缺失比例较大的变量
qualiVar.GY <- qualiVar[!is.na(qualiVar$GarageYrBlt),]
qualiVar.GY[,c("LotFrontage","MasVnrArea")] <- NULL #暂时删去缺失值较多的变量,方便后续处理
a <- cor(qualiVar.GY)
which(a>0.75 & a<1, arr.ind = TRUE)  #找到数据的相应位置
b <- c(11,23)
c <- c(10,5)
head(a[c,b],length(c))

以上结果可以看到,GarageYrBlt缺失值很多,又与YearBuilt变量相关性极强,故删去。
考察LotFrontage变量
qualiVar.LF <- qualiVar[!is.na(qualiVar$LotFrontage),]
x <- qualiVar.LF$SalePrice
y <- qualiVar.LF$LotFrontage
cor(x,y)
LotFrontage变量与房价的相关系数为0.3518,虽然其缺失比例较高,但不能轻易删除。
排除掉数值型变量中的少量缺失值,考察变量间的相关性
qualiVar.LF[,"GarageYrBlt"] <- NULL
qualiVar.LF.MV <- qualiVar.LF[!is.na(qualiVar.LF$MasVnrArea),]
a <- cor(qualiVar.LF.MV)
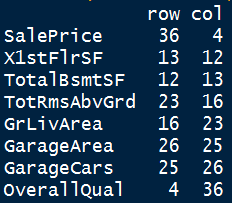
which(a>0.75 & a<1, arr.ind = TRUE)
b <- c(4,12,13,16,23,25,26,36)
c <- c(36,13,12,23,16,26,25,4)
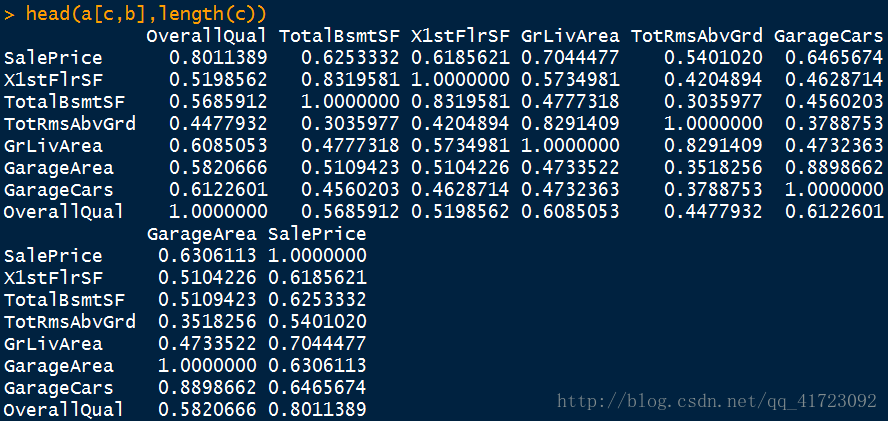
head(a[c,b],length(c))小结:
- TotalBsmtSF和X1stFlrSF 0.8319581
- GrLlvArea和TotRmsAbvGrd 0.8291409
- GarageArea和GarageCars 0.8898662
- 以上是相关性较大的3组数,需要考虑删去。与房价相关性较高的变量是重要变量。
- 经过考虑,删去上面标红的变量。
a <- c("GarageYrBlt","TotRmsAbvGrd","GarageArea")
qualiVar01 <- qualiVar #备份
qualiVar[, a] <- NULL
data.qualiVar <- data[aa][-1]
data.typeVar <- data[bb]
data.qualiVar01 <- data.qualiVar #备份
data.qualiVar[, a] <- NULL
至此,需要考虑对数值型变量进行下一步操作,即缺失值补全。
针对数值型变量,采用多重插补的方式填补缺失数据
引用mice包中的插补函数
library(mice)
imp <- mice(data.qualiVar02, seed = 1234)
fit <- with(imp, lm(LotFrontage ~ WoodDeckSF + TotalBsmtSF + YearBuilt + Fireplaces + LotArea +OverallCond + BsmtFullBath + EnclosedPorch + MasVnrArea))
pooled <- pool(fit)data.qualiVarFil <- complete(imp, action = 1)
temp <- sapply(data.qualiVarFil, function(x) sum(is.na(x)) )
miss <- sort(temp, decreasing=T)
miss[miss>0]
#将插补后的数据与房价数据组合
qualiVar02 <- cbind(data.qualiVarFil[train.row,],qualiVar$SalePrice)
names(qualiVar02)[34]<- "SalePrice" #R 修改列名检查数据是否满足统计假设
fm.base <- SalePrice ~ MSSubClass + LotFrontage +LotArea +OverallQual +OverallCond + YearBuilt +YearRemodAdd + MasVnrArea + BsmtFinSF1+BsmtFinSF2 + BsmtUnfSF + TotalBsmtSF + X1stFlrSF+X2ndFlrSF+LowQualFinSF + GrLivArea + BsmtFullBath + BsmtHalfBath + FullBath + HalfBath +BedroomAbvGr + KitchenAbvGr + Fireplaces+GarageCars + WoodDeckSF + OpenPorchSF + EnclosedPorch + X3SsnPorch + ScreenPorch + PoolArea + MiscVal + MoSold + YrSold

#R基础安装中的回归分析检验方法
fit <- lm(fm.base , data = qualiVar02)
par(mfrow = c(2,2))
plot(fit)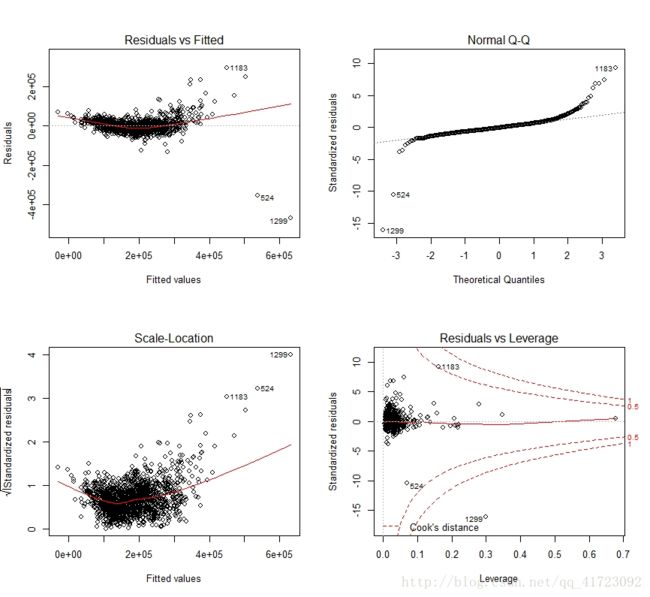
上图中可以看出:
1,右上图表明数据不满足正态性假设。如果满足正态性假设,数据点应该沿对角直线分布;
2,左上图表明,数据不满足线性假设,可以看出因变量与自变量有某种曲线关系;
3,左下的图综合那个,数据似乎沿红色曲线有一定规律地分布,因此同方差性也不满足;
4,右下的图中表明有异常点,如1299、524。
需要对部分变量进行对数化处理,以得到更好的拟合结果。这里先到此为止,后面会有进一步处理。
采用散点图考察各数值型变量的密度分布情况以及与SalePrice的大致关系:
scatterplotMatrix(~ SalePrice + MSSubClass + LotFrontage +LotArea+ OverallQual + OverallCond, data = qualiVar02,
                  spread = FALSE, smoother.args = list(lty = 2),
                  main = "Scatter Plot Matrix via car Package")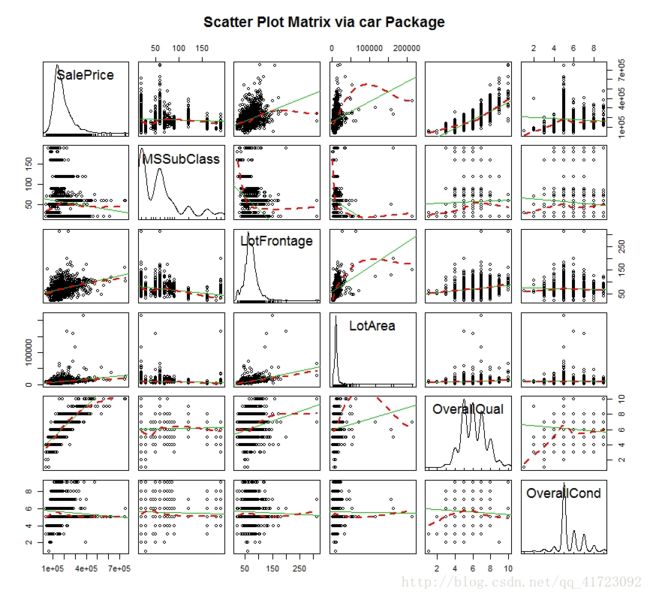
上图中可以看到:
1,SalePrice、LotFrontage、LotArea呈左偏;
2,MSSubClass、OverallCond呈离散分布状,与SalePrice之间的关系不明显;
3,LotFrontage、LotArea与Price有一定的线性关系,但受几个异常点影响较大;
4,OverallQual也呈离散分布,但与SalePrice有较明显的关联。
采用同样的方式考察所有的数值型变量,并对部分变量做进一步分析观察,例如:
library(ggplot2)
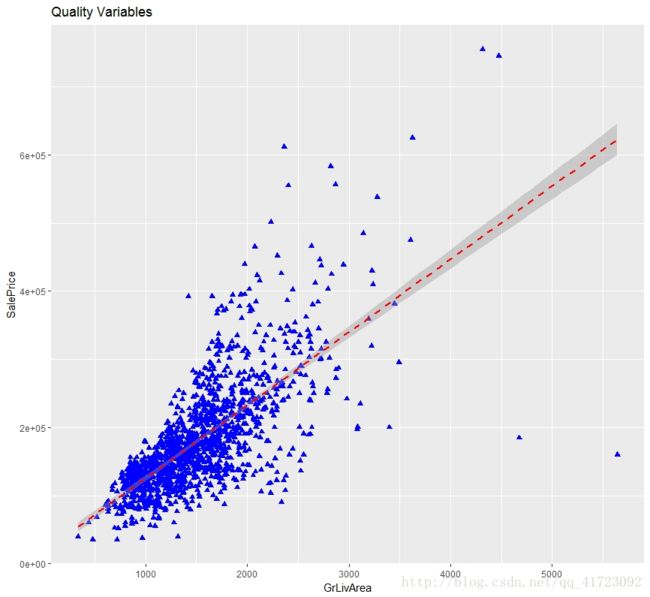
ggplot(data = qualiVar02, aes(x = GrLivArea, y = SalePrice)) + geom_point(pch = 17, color = "blue", size = 2) + geom_smooth(method = "lm", color = "red", linetype = 2) + labs(title = "Quality Variables", x = "GrLivArea", y = "SalePrice")
fit <- lm(SalePrice ~ GrLivArea , data = qualiVar02)
par(mfrow = c(2,2))
plot(fit)
可见SalePrice与GrLivArea 变量之间存在一定的线性关系,但在异常点的影响下,两者的关系出现了偏斜。
经过此部分分析,小结:
1,数据不满足统计假设,需要进行处理,大部分数据呈现左偏;
2,部分数据虽然是数值型,但是明显是离散变量,而且与SalePrice间并无明显关联;
3,异常点的存在影响了对数据间关系的探索,考虑删去。
进一步考虑删除与SalePrice相关性极弱的变量:
x <- qualiVar02[-34]
y <- qualiVar02[34]
corSale <- data.frame(cor(x,y))
which(abs(corSale) < 0.05, arr.ind = TRUE)
以上是对这部分与SalePrice相关性小于0.05的变量的解释,从字面上理解,这些变量的确与房屋售价关系不大。售卖的年份也许会有一定影响,但从两变量散点图中看不出来。另外,3SsnPorch即为X3SsnPorch的值,参考文献中弄错了。
删去这部分变量:
Drop <- names(qualiVar02) %in% c("BsmtFinSF2","LowQualFinSF","BsmtHalfBath","X3SsnPorch","MoSold","YrSold","MiscVal")
qualiVar02 <- qualiVar02[!Drop]

Drop <- names(data.qualiVarFil) %in% c("BsmtFinSF2","LowQualFinSF","BsmtHalfBath","X3SsnPorch","MoSold","YrSold","MiscVal")
data.qualiVarFil  <- data.qualiVarFil[!Drop]
dataQual <- cbind(data.qualiVarFil, data.qualiVar[34])
处理因子型变量数据
data.typeVar
temp <- sapply(data.typeVar, function(x)  sum(is.na(x)) )
miss <- sort(temp, decreasing=T)
miss[miss>0]
观察缺失数量最多的几个变量:
a <- c("PoolQC","MiscFeature","Alley","Fence","FireplaceQu")
summary(data.typeVar[a])
看上去这些变量的类型还是蛮丰富的,需要再作观察。
for (x in a) {
data.typeVar[[x]] <- factor(data.typeVar[[x]], levels= c(levels(data.typeVar[[x]]),c('None')))
data.typeVar[[x]][is.na(data.typeVar[[x]])] <- "None"
}
data.typeVar01 <- cbind(data.typeVar, data.qualiVar[34])
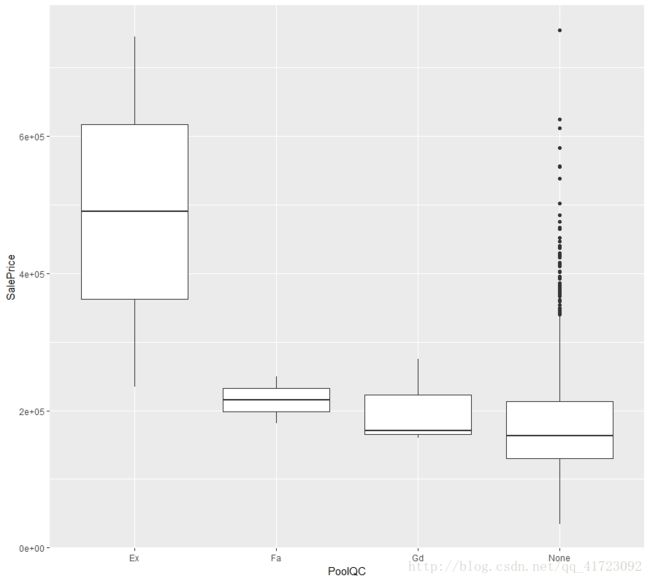
ggplot(data.typeVar01[train.row,], aes(x = PoolQC, y = SalePrice)) + geom_boxplot()
将以上因子型变量中添加"None"项,并绘制出各变量与SalePrice之间的箱形图:
通过观察以上缺失值较大的无序因子与SalePrice的箱形图,发现PoolQC、FireplaceQu这两个因子(特别是增加了层次"None"后)似乎与SalePrice存在某种关系,故予以保留,其他三个值删去。
Drop <- names(data.typeVar) %in% c("MiscFeature","Alley","Fence")
data.typeVar  <- data.typeVar[!Drop]
针对车库与地下室相关的变量,将缺失值视为无序因子的新类型,"None"
Garage <- c("GarageType","GarageQual","GarageCond","GarageFinish")
Bsmt <- c("BsmtExposure","BsmtFinType2","BsmtQual","BsmtCond","BsmtFinType1")
for (x in c(Garage, Bsmt) )
{
    data.typeVar[[x]] <- factor( data.typeVar[[x]], levels= c(levels(data.typeVar[[x]]),c('None')))
    data.typeVar[[x]][is.na(data.typeVar[[x]])] <- "None"
}data[["MasVnrType"]][is.na(data[["MasVnrType"]])] <- "None"Utilities大部分为AllPub,区分度不大,对预测没有帮助,删去
data$Utilities <- NULL
names(data)
剩下的变量都是字符型变量,并且只有个位数的缺失值,可以像数值型变量用众数代替的理念用各自出现最多的字符来代替。
Req <- c("MSZoning","Functional","Exterior1st","Exterior2nd","KitchenQual","Electrical","SaleType")
for (x in Req)    {
    data[[x]][is.na(data[[x]])] <- levels(data[[x]])[which.max(table(data[[x]]))]
}
将处理后的数据集拆分为训练集和测试集。
data.trim <- cbind(dataQual,data.typeVar)
data.trim01 <- cbind(data.trim, data[1])
train <- data.trim01[train.row,]
test <- data.trim01[test.row,]
#删去异常值
a <- c(1299,524)
train <- train[-a,]
建立简单线性模型,作为后续对比的基础
fm.base <- log(SalePrice) ~ MSSubClass + LotFrontage + log(LotArea) +OverallQual +OverallCond + YearBuilt +YearRemodAdd + MasVnrArea + BsmtFinSF1 + BsmtUnfSF + TotalBsmtSF + X1stFlrSF+X2ndFlrSF+ log(GrLivArea) + BsmtFullBath + FullBath + HalfBath +BedroomAbvGr + KitchenAbvGr + Fireplaces+GarageCars + WoodDeckSF + OpenPorchSF + EnclosedPorch + ScreenPorch + PoolArea
lm.base <- lm(fm.base, train)
上面对几个明显需要处理的变量进行了对数化处理,以求满足正态性假设。
预测并保存结果:
lm.pred <- predict(lm.base, test)
temp <- data.frame(Id = test$Id, SalePrice = lm.pred)
write.csv(temp, file = "...\\price_base.csv", row.names = FALSE)二,建模并预测
1,逐步回归
定义空函数与全变量函数:
null=lm(log(SalePrice)~1, data=train)
full=lm(log(SalePrice)~ .-Id , data=train)set.seed(1234)
lm.for <- step(null, scope=list(lower=null, upper=full), direction="forward")
lm.pred <- predict(lm.for,test)
res <- data.frame(Id = test$Id, SalePrice = exp(lm.pred))
write.csv(res, file = "...\\price_step.csv", row.names = FALSE)上传数据到Kaggle,得到结果:
2,Lasso回归
library(glmnet)
LASSO_formula <- as.formula(log(SalePrice)~ .-Id )
x <- model.matrix(LASSO_formula, train)
y <- log(train$SalePrice)

set.seed(1234)
lm.lasso <- cv.glmnet(x, y, alpha=1)
test$SalePrice <- 1
test_x <- model.matrix(LASSO_formula, test)lm.pred <- predict(lm.lasso, newx = test_x, s = "lambda.min")
res <- data.frame(Id = test$Id, SalePrice = exp(lm.pred))
write.csv(res, file = "...\\price_lasso.csv", row.names = FALSE)
上传数据到Kaggle,得到结果:
3,随机森林
set.seed(1234)
library(party)
model <- cforest(log(SalePrice)~.-Id, data = train, controls=cforest_unbiased(ntree=2000, mtry=3))
predict.result <- predict(model,test,OOB=TRUE,type="response")
res <- data.frame(Id = test$Id, SalePrice = exp(predict.result))
write.csv(res, file = "...\\price_rf.csv", row.names = FALSE)
上传数据到Kaggle,得到结果:
4,GBDT算法
library(gbm)
library(caret)

set.seed(1234)
ctrl <- trainControl(method = "cv", number = 10, verboseIter = TRUE)
lm.gbm <- train(log(SalePrice)~ .-Id, data = train,  method = "gbm",  trControl = ctrl)
lm.pred <- predict(lm.gbm, test)
res <- data.frame(Id = test$Id, SalePrice = exp(lm.pred))

write.csv(res, file = "...\\price_gbm.csv", row.names = FALSE)
上传数据到Kaggle,得到结果:
三,总结
根据全文分析,总结如下:
- 1,各算法结果中,Lasso回归是效果最好的,说明该项目中的许多变量都是没有意义的扰乱项,放入模型中反而会成为噪声;
- 2,简单线性回归的结果与其他方式的结果相差很大,说明变量需要进行进一步变形处理。
虽然取得了850名左右的成绩,但是前面仍然高手如林。要进一步提高成绩的话,有以下方向可以考虑:
1,进一步细化处理变量;
2,对现有算法的参数进行调整;
3,引入其他算法进行计算。


