pyecharts-动态可视化(2) 柱状图 时间轴/折线/堆叠/水印/瀑布图
pyecharts中 柱状图的形式 应该基本就在这了!!代码可以直接运行~超级详细的注释,还有动图呢!!
在制作柱状图可能会遇到的组合,所需用到的代码均做了注释,用的V1版本。非常的小白,非常的友好!!
- 弹跳动画+水平线标注+点点标注
- 加入了时间轴的柱状图
- 水平线/圈选/切换柱状图、折线、堆叠
- 混合柱状和折线
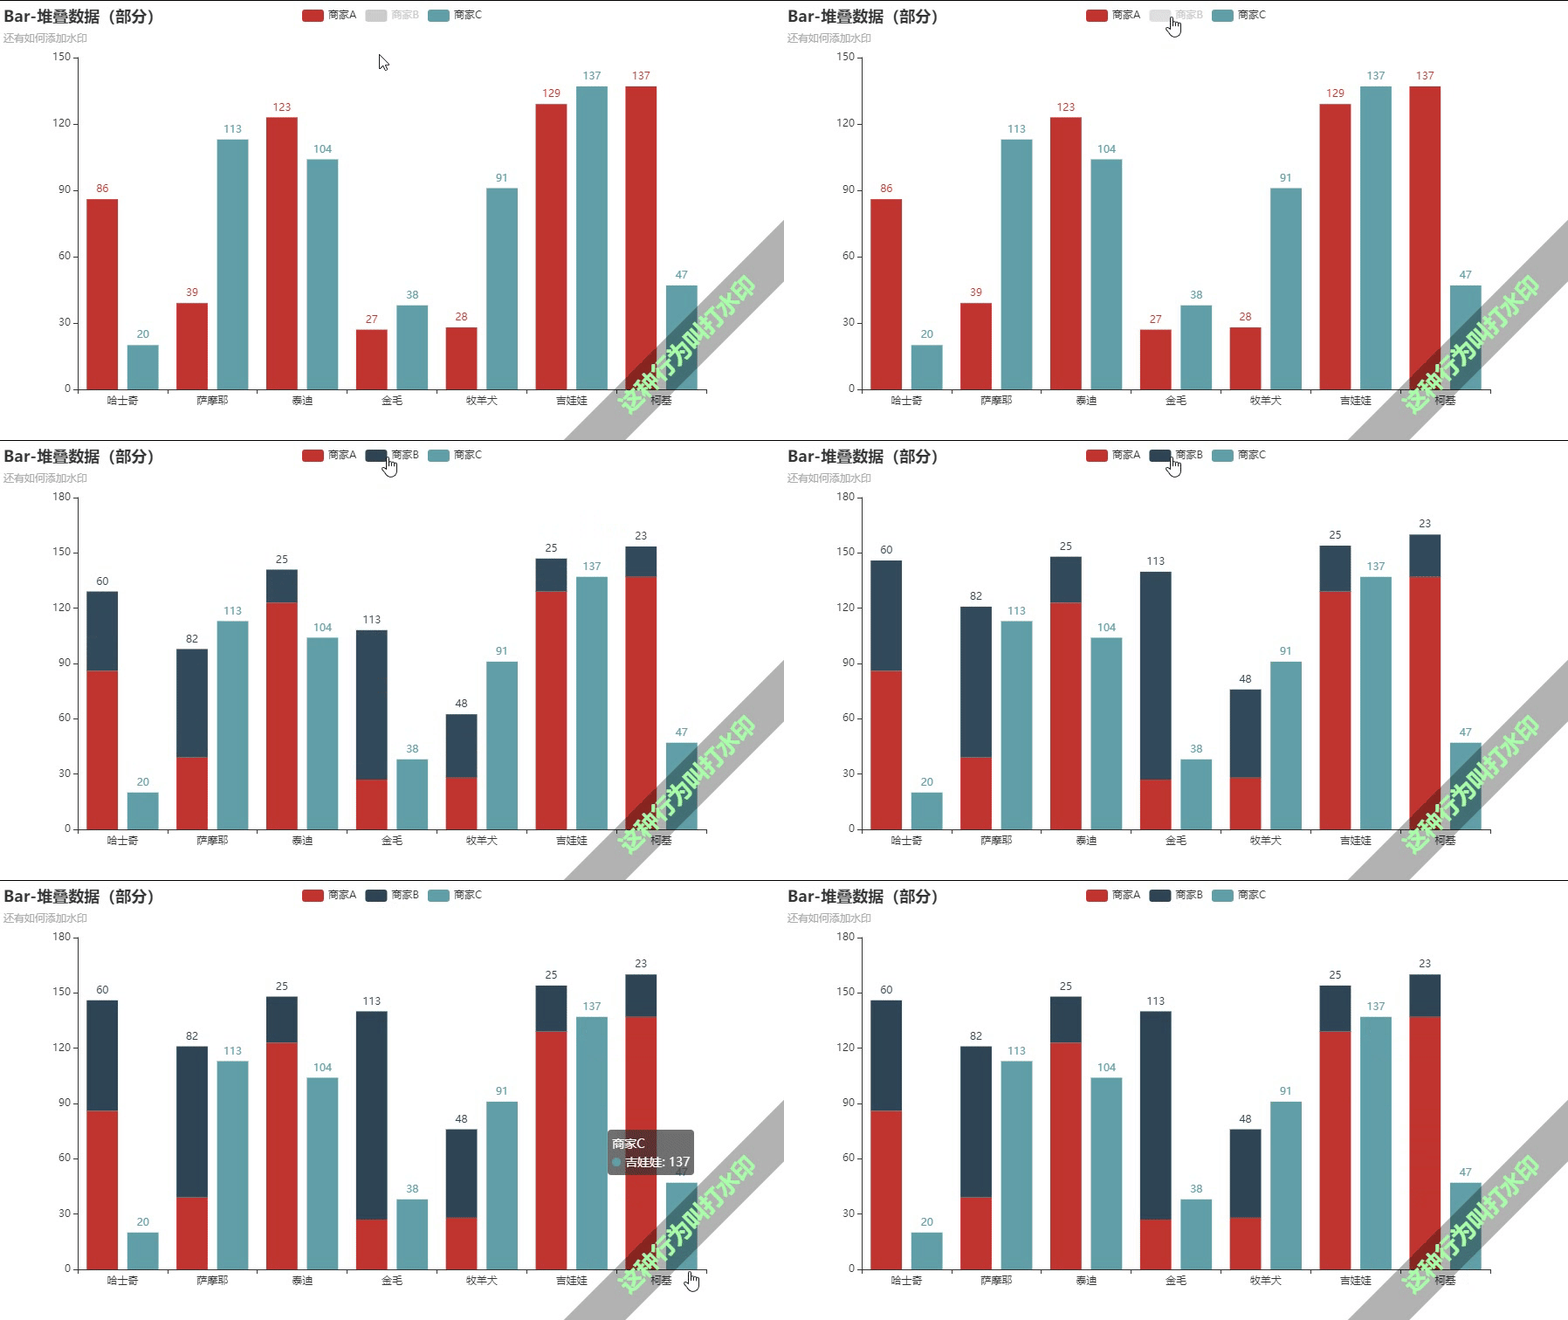
- 部分堆叠+打水印
- 堆叠柱状图
- 旋转x轴、y轴标签
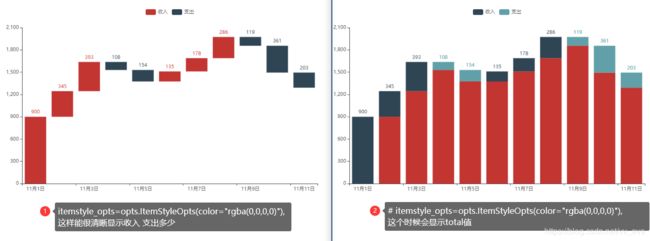
- 瀑布图
弹跳动画+水平线标注+点点标注
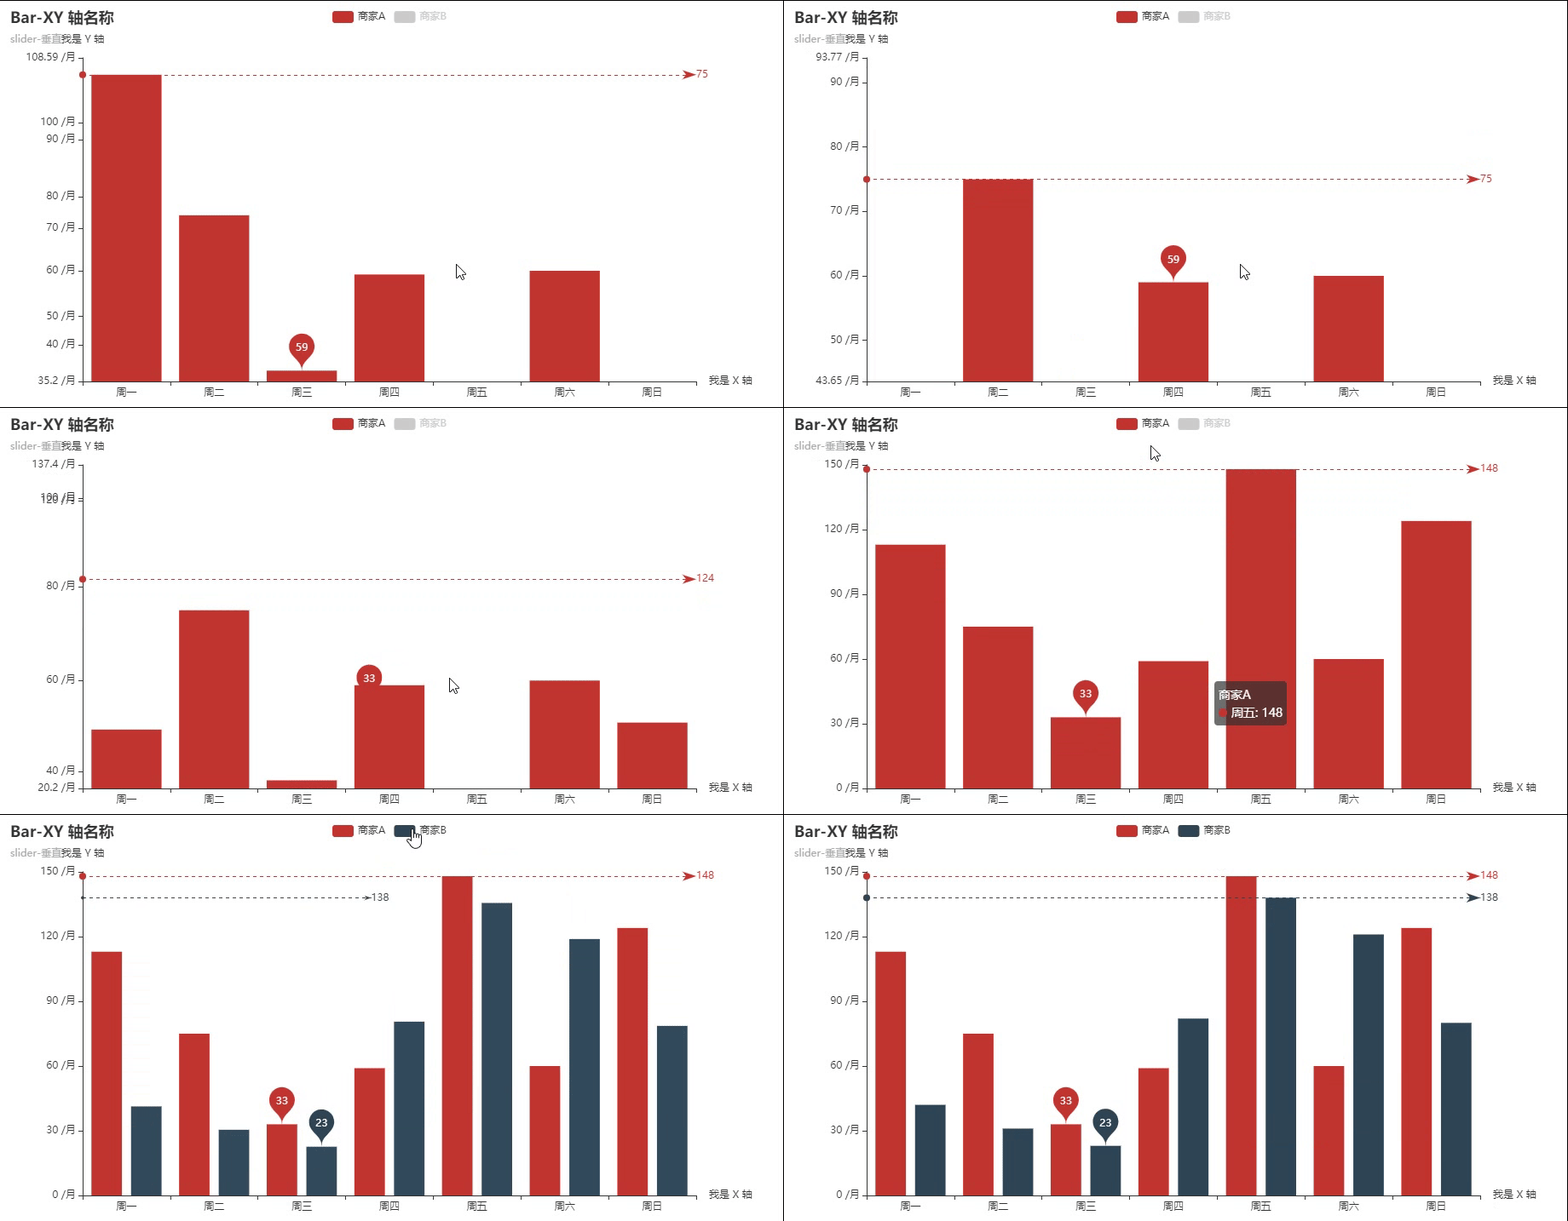
弹跳动画: animation_easing="elasticOut"
取消默认显示:is_selected=False
单位标注: axislabel_opts=opts.LabelOpts(formatter="{value} /月")
点点的标注: markpoint_opts=opts.MarkPointOpts() 可以选择平均值/最小值/最大值标注,也可以自拟任意值
水平线的标注:markline_opts=opts.MarkLineOpts( )
from pyecharts import options as opts
from pyecharts.charts import Bar
from pyecharts.faker import Faker
c = (
     #加了动画
    Bar(init_opts=opts.InitOpts(
            animation_opts=opts.AnimationOpts(
                animation_delay=100, animation_easing="elasticOut"
            )
        ))
    .add_xaxis(Faker.choose())
    .add_yaxis("商家A", Faker.values())
    .add_yaxis("商家B", Faker.values(), is_selected=False) #取消默认显示
    .set_global_opts(
        title_opts=opts.TitleOpts(title="Bar-XY 轴名称",subtitle="slider-垂直"),
        yaxis_opts=opts.AxisOpts(name="我是 Y 轴",  # y轴名称
                                 axislabel_opts=opts.LabelOpts(formatter="{value} /月")),  #单位标注
        xaxis_opts=opts.AxisOpts(name="我是 X 轴"), #x轴名称
        datazoom_opts=opts.DataZoomOpts(orient="vertical",type_="inside"), #垂直 slider
    )
#标注最大值和最小值
    .set_series_opts(
        label_opts=opts.LabelOpts(is_show=False),
        markpoint_opts=opts.MarkPointOpts(
            data=[
                opts.MarkPointItem(type_="min", name="最小值"), #这个用线拉
                 ]
        ),
        markline_opts=opts.MarkLineOpts(
            data=[
                opts.MarkLineItem(type_="max", name="最大值"), #这个点标注
            ]
        ),
    )
    .render("bar_xyaxis_name.html")
)
加入了时间轴的柱状图
背景颜色的设置:init_opts=opts.InitOpts(theme=ThemeType.LIGHT)
时间轴以及饼图的生成~
官网代码运行后会出现:
TypeError: add_yaxis() got an unexpected keyword argument 'yaxis_data’
解决方法:将yaxis_data 改成y_axis ,上面的代码已经改好了相关问题,替换即可运行。
划重点!! 对y轴进行赋值最新版本不能用yaxis_data,要用 y_axis
# 2002 - 2011 年的数据
def get_year_overlap_chart(year: int) -> Bar:
    bar = (
        Bar(init_opts=opts.InitOpts(theme=ThemeType.LIGHT)) #改了背景颜色
        .add_xaxis(xaxis_data=name_list)
        .add_yaxis(
            series_name="GDP",
            y_axis=total_data["dataGDP"][year], #对y轴进行赋值最新版本不能用yaxis_data,要用y_axis
            is_selected=False,
            label_opts=opts.LabelOpts(is_show=False),
        )
        .add_yaxis(
            series_name="金融",
            y_axis=total_data["dataFinancial"][year],
            is_selected=False,
            label_opts=opts.LabelOpts(is_show=False),
        )
        .add_yaxis(
            series_name="房地产",
            y_axis=total_data["dataEstate"][year],
            is_selected=False,
            label_opts=opts.LabelOpts(is_show=False),
        )
        .add_yaxis(
            series_name="第一产业",
            y_axis=total_data["dataPI"][year],
            label_opts=opts.LabelOpts(is_show=False),
        )
        .add_yaxis(
            series_name="第二产业",
            y_axis=total_data["dataSI"][year],
            label_opts=opts.LabelOpts(is_show=False),
        )
        .add_yaxis(
            series_name="第三产业",
            y_axis=total_data["dataTI"][year],
            label_opts=opts.LabelOpts(is_show=False),
        )
        .set_global_opts(
            title_opts=opts.TitleOpts(
                title="{}全国宏观经济指标".format(year), subtitle="数据来自国家统计局"
            ),
            tooltip_opts=opts.TooltipOpts(
                is_show=True, trigger="axis", axis_pointer_type="shadow"
            ),
        )
    )
    pie = (
        Pie()
        .add(
            series_name="GDP占比",
            data_pair=[
                ["第一产业", total_data["dataPI"]["{}sum".format(year)]],
                ["第二产业", total_data["dataSI"]["{}sum".format(year)]],
                ["第三产业", total_data["dataTI"]["{}sum".format(year)]],
            ],
            center=["75%", "35%"],
            radius="28%",
        )
        .set_series_opts(tooltip_opts=opts.TooltipOpts(is_show=True, trigger="item"))
    )
    return bar.overlap(pie)
# 生成时间轴的图
timeline = Timeline(init_opts=opts.InitOpts(width="1200px", height="560px")) #长度 宽度设置
for y in range(2002,2012):  #时间轴
    timeline.add(get_year_overlap_chart(year=y), time_point=str(y))
timeline.add_schema(is_auto_play=True, play_interval=1000) #自动播放与否,以及时间间隔
timeline.render("finance_indices.html")
水平线/圈选/切换柱状图、折线、堆叠
水平线:datazoom_opts=opts.DataZoomOpts()
圈选功能:brush_opts=opts.BrushOpts()
切换折线/堆叠/柱状 :toolbox_opts=opts.ToolboxOpts()
图例的类型(商家A/商家B)显示与否:legend_opts=opts.LegendOpts(is_show=True)
from pyecharts import options as opts
from pyecharts.charts import Bar
c = (
    Bar(init_opts=opts.InitOpts(theme='dark')) #背景颜色
    .add_xaxis(['0天', '1天', '2天', '3天', '4天', '5天', '6天', '7天', '8天', '9天', '10天', '11天', '12天', '13天', '14天', '15天', '16天', '17天', '18天', '19天', '20天', '21天', '22天', '23天', '24天', '25天', '26天', '27天', '28天', '29天'])
    .add_yaxis("商家A", [3, 12, 24, 6, 10, 20, 28, 24, 7, 15, 18, 15, 20, 11, 10, 25, 30, 25, 19, 11, 23, 24, 13, 18, 18, 8,17, 11, 24, 10])
    .add_yaxis("商家B", [13, 2, 4, 16, 10, 20, 28, 24, 7, 15, 18, 15, 2, 1, 1, 5, 0, 2, 9, 1, 3, 4, 3, 8, 1, 8,7, 1, 4, 0])
    .set_global_opts(
        title_opts=opts.TitleOpts(title="柱状图",subtitle="slider-水平/圈选功能/切换折线、堆叠、柱状"),
        datazoom_opts=opts.DataZoomOpts(), #水平线
        brush_opts=opts.BrushOpts(), #允许圈选功能
        toolbox_opts=opts.ToolboxOpts(),#允许切换折线/堆叠/柱状
        legend_opts=opts.LegendOpts(is_show=True,#图例的类型 这个就是商家A 商家B那个显示与否
                                    type_ = 'plain', # 图例的类型。可选值;'plain':普通图例。缺省就是普通图例。'scroll':可滚动翻页的图例。当图例数量较多时可以使用。
                                    ),
    )
    .render("bar_datazoom_slider.html")
)
混合柱状和折线
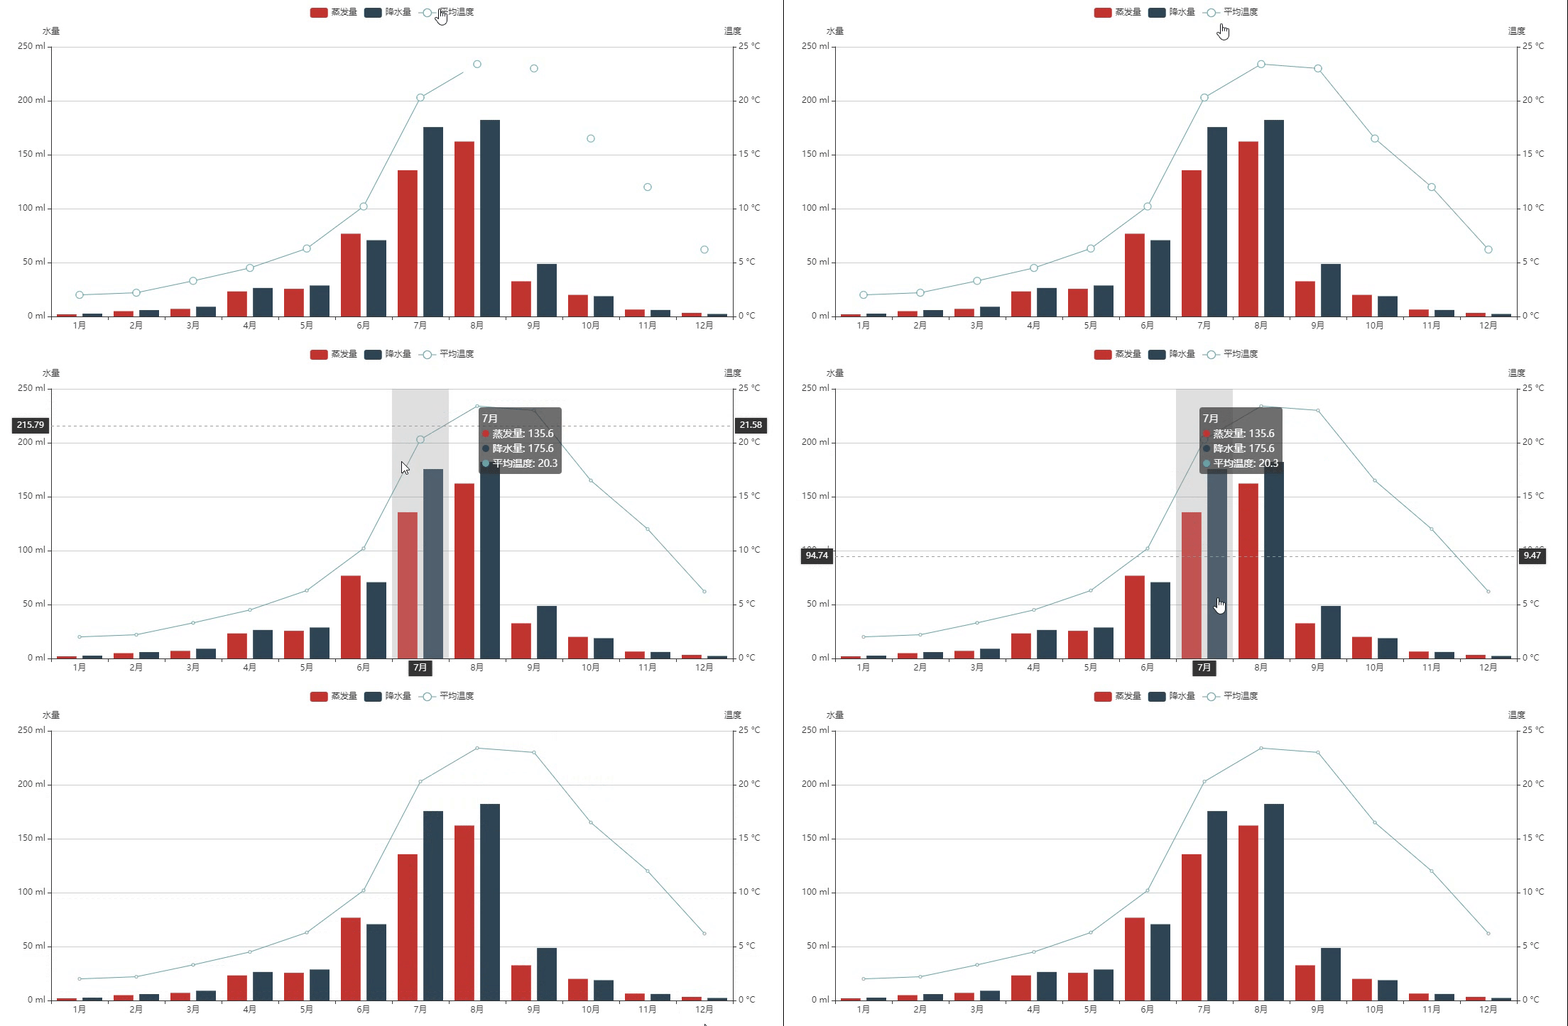
设置柱形图长宽:init_opts=opts.InitOpts(width="1200px", height="500px")
import pyecharts.options as opts
from pyecharts.charts import Bar, Line
x_data = ["1月", "2月", "3月", "4月", "5月", "6月", "7月", "8月", "9月", "10月", "11月", "12月"]
bar = (
    Bar(init_opts=opts.InitOpts(width="1200px", height="500px")) #设置柱形图长宽
    .add_xaxis(xaxis_data=x_data)
    .add_yaxis(
        series_name="蒸发量",
        y_axis=[2.0,4.9,7.0,23.2,25.6,76.7,135.6,162.2,32.6,20.0,6.4,3.3,],
        label_opts=opts.LabelOpts(is_show=False),
    )
    .add_yaxis(
        series_name="降水量",
        y_axis=[2.6,5.9,9.0,26.4,28.7,70.7,175.6,182.2,48.7,18.8,6.0,2.3,],
        label_opts=opts.LabelOpts(is_show=False),
    )
    .extend_axis(
        yaxis=opts.AxisOpts(
            name="温度",type_="value",min_=0,max_=25,interval=5,
            axislabel_opts=opts.LabelOpts(formatter="{value} °C"),
        )
    )
    .set_global_opts(
        tooltip_opts=opts.TooltipOpts(
            is_show=True, trigger="axis", axis_pointer_type="cross"
        ),
        xaxis_opts=opts.AxisOpts(
            type_="category",
            axispointer_opts=opts.AxisPointerOpts(is_show=True, type_="shadow"),
        ),
        yaxis_opts=opts.AxisOpts(
            name="水量",type_="value",
            min_=0,max_=250,interval=50,
            axislabel_opts=opts.LabelOpts(formatter="{value} ml"),
            axistick_opts=opts.AxisTickOpts(is_show=True),
            splitline_opts=opts.SplitLineOpts(is_show=True),
        ),
    )
)
line = (
    Line()
    .add_xaxis(xaxis_data=x_data)
    .add_yaxis(
        series_name="平均温度",
        yaxis_index=1,
        y_axis=[2.0, 2.2, 3.3, 4.5, 6.3, 10.2, 20.3, 23.4, 23.0, 16.5, 12.0, 6.2],
        label_opts=opts.LabelOpts(is_show=False),
    )
)
bar.overlap(line).render("mixed_bar_and_line.html")
部分堆叠+打水印
from pyecharts import options as opts
from pyecharts.charts import Bar
from pyecharts.faker import Faker
c = (
    Bar()
    .add_xaxis(Faker.choose())
    .add_yaxis("商家A", Faker.values(), stack="stack1") #部分堆叠
    .add_yaxis("商家B", Faker.values(), stack="stack1")
    .add_yaxis("商家C", Faker.values())
    .set_series_opts(label_opts=opts.LabelOpts(is_show=True))
    .set_global_opts(title_opts=opts.TitleOpts(title="Bar-堆叠数据(部分)",subtitle="还有如何添加水印"),
            graphic_opts=[
            opts.GraphicGroup(
                graphic_item=opts.GraphicItem(
                    rotation=JsCode("Math.PI / 4"), #这个是水印的位置
                    bounding="raw",
                    right=110,
                    bottom=110,
                    z=100,
                ),
                children=[
                    opts.GraphicRect(
                        graphic_item=opts.GraphicItem(
                            left="center", top="center", z=1000 #z的数值越小 水印文字颜色越亮
                        ),
                        graphic_shape_opts=opts.GraphicShapeOpts(width=400, height=50), #水印长宽
                        graphic_basicstyle_opts=opts.GraphicBasicStyleOpts(
                            fill="rgba(0,0,0,0.3)"
                        ),
                    ),
                    opts.GraphicText(
                        graphic_item=opts.GraphicItem(
                            left="center", top="center", z=1000 #这个z值的大小 好神奇,不知道是什么意思 可能是图层上下?
                        ),
                        graphic_textstyle_opts=opts.GraphicTextStyleOpts(
                            text="这种行为叫打水印",  #输入文字
                            font="bold 26px Microsoft YaHei", #字体
                            graphic_basicstyle_opts=opts.GraphicBasicStyleOpts(
                                fill="#afa"  #这是字体那个美腻的绿
                            ),
                        ),
                    ),
                ],
            )
        ],)
    .render("bar_stack1.html")
)
堆叠柱状(1 of 2)
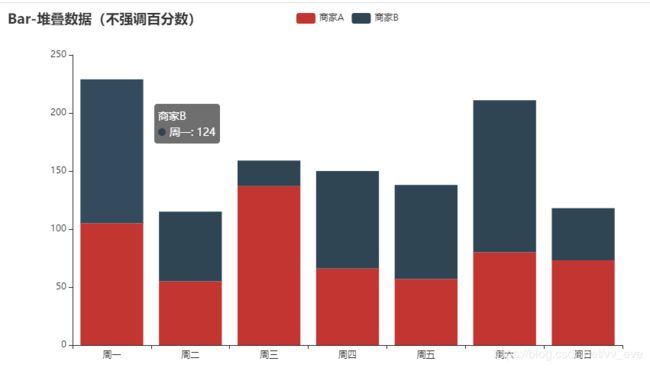 堆叠柱状:
堆叠柱状:stack="stack1"
显示数字与否:label_opts=opts.LabelOpts(is_show=False)
from pyecharts import options as opts
from pyecharts.charts import Bar
c = (
    Bar()
    .add_xaxis(['周一', '周二', '周三', '周四', '周五', '周六', '周日'])
    .add_yaxis("商家A", [105, 55, 137, 66, 57, 80, 73], stack="stack1")  # stack="stack1" 选择堆叠
    .add_yaxis("商家B",[124, 60, 22, 84, 81, 131, 45], stack="stack1")
    .set_series_opts(label_opts=opts.LabelOpts(is_show=False))
    # 如果说选择 is_show=True 就是会在柱状图上显示数字,但其实没什么用,因为会只显示商家B的数字
    .set_global_opts(title_opts=opts.TitleOpts(title="Bar-堆叠数据(不强调百分数)"))
    .render("bar_stack0.html")
堆叠柱状(2 of 2)
这个就有百分数,但个人觉得没什么用
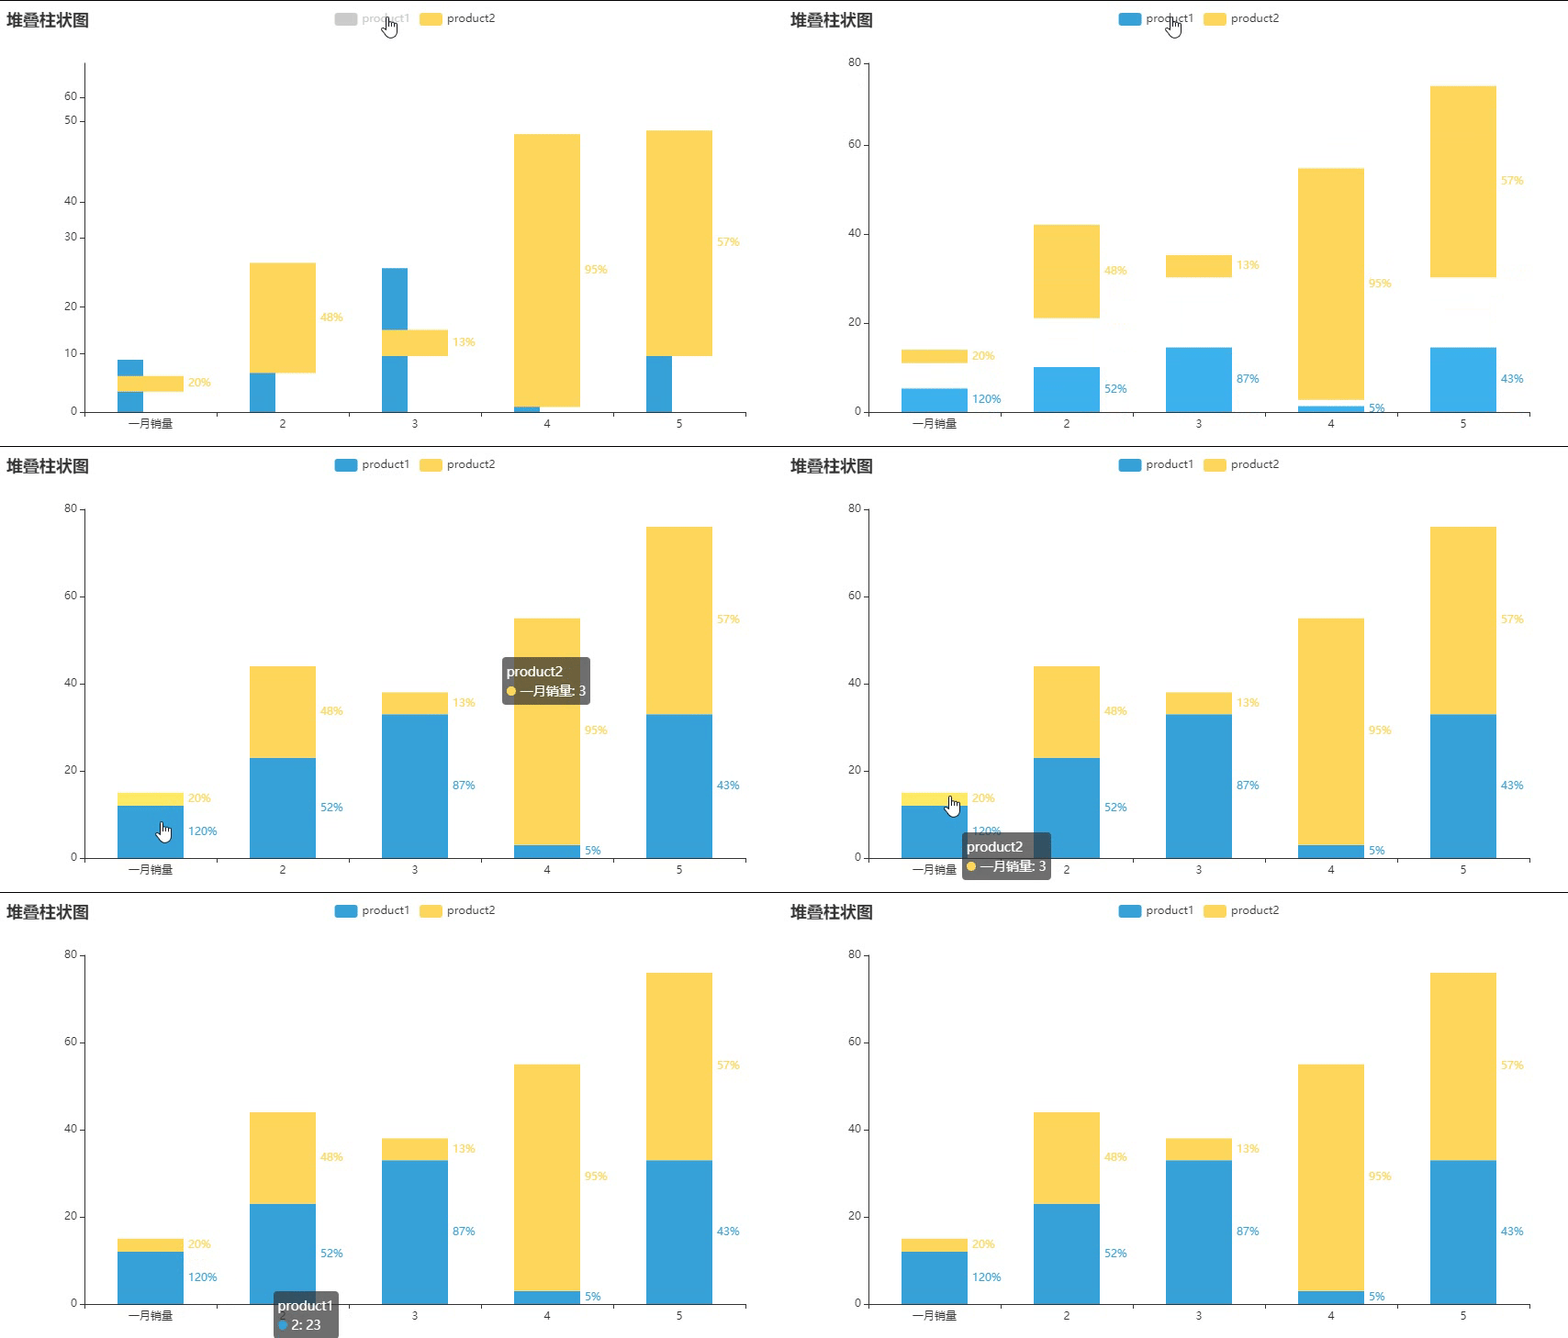
百分数:{"value": 12,"percent": 1.2}
from pyecharts import options as opts
from pyecharts.charts import Bar
from pyecharts.commons.utils import JsCode
from pyecharts.globals import ThemeType

list1 = [
    {"value": 12,"percent": 1.2}, #"value": 必为数字,"percent": 自拟数字,可以公式计算也可以自己输入
    {"value": 23, "percent": 23 / (23 + 21)},
    {"value": 33, "percent": 33 / (33 + 5)},
    {"value": 3, "percent": 3 / (3 + 52)},
    {"value": 33, "percent": 33 / (33 + 43)},
]

list2 = [
    #{"value": 3, "percent": 3 / (12 + 3)},
    {"value": 3,"percent": 0.2},
    {"value": 21, "percent": 21 / (23 + 21)},
    {"value": 5, "percent": 5 / (33 + 5)},
    {"value": 52, "percent": 52 / (3 + 52)},
    {"value": 43, "percent": 43 / (33 + 43)},
]

c = (
    Bar(init_opts=opts.InitOpts(theme=ThemeType.LIGHT))
    .add_xaxis(["一月销量", 2, 3, 4, 5]) #x轴标签
    .add_yaxis("product1", list1, stack="stack1", category_gap="50%") #柱状的间距
    .add_yaxis("product2", list2, stack="stack1", category_gap="50%")
    .set_series_opts(
        label_opts=opts.LabelOpts(
            position="right",
            formatter=JsCode(
                "function(x){return Number(x.data.percent * 100).toFixed() + '%';}"
            ),
        )
    )
    .set_global_opts(
       title_opts=opts.TitleOpts(title="堆叠柱状图"),
    )
    .render("stack_bar_percent.html")
)
旋转x轴、y轴标签
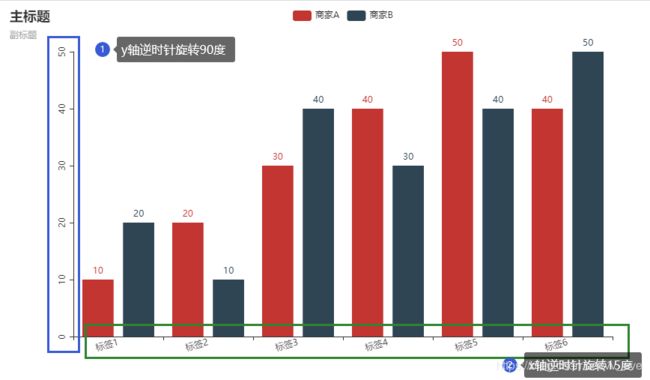
旋转标签:axislabel_opts=opts.LabelOpts(rotate= )
from pyecharts.charts import Bar
from pyecharts import options as opts
c = (
    Bar()
    .add_xaxis([ "标签1", "标签2","标签3","标签4", "标签5", "标签6",]
    )
    .add_yaxis("商家A", [10, 20, 30, 40, 50, 40])
    .add_yaxis("商家B", [20, 10, 40, 30, 40, 50])
    .set_global_opts(
        xaxis_opts=opts.AxisOpts(axislabel_opts=opts.LabelOpts(rotate=15)), #旋转X轴标签,这里指顺时针旋转15°
        yaxis_opts=opts.AxisOpts(axislabel_opts=opts.LabelOpts(rotate=90)), #旋转y轴标签
        title_opts=opts.TitleOpts(title="主标题", subtitle="副标题"),
    )
    .render("bar_rotate_xaxis_label.html") #文件命名
)
瀑布图
from pyecharts.charts import Bar
from pyecharts import options as opts
x_data = [f"11月{str(i)}日" for i in range(1, 12)] #一个循环写了日期
y_total = [0, 900, 1245, 1530, 1376, 1376, 1511, 1689, 1856, 1495, 1292]
y_in = [900, 345, 393, "-", "-", 135, 178, 286, "-", "-", "-"] #"-"表示无数值
y_out = ["-", "-", "-", 108, 154, "-", "-", "-", 119, 361, 203]
bar = (
    Bar()
    .add_xaxis(xaxis_data=x_data)
    .add_yaxis(
        series_name="",
        y_axis=y_total,
        stack="总量",
        itemstyle_opts=opts.ItemStyleOpts(color="rgba(0,0,0,0)"), #这个有无的差异。放在了上图
    )
    .add_yaxis(series_name="收入", y_axis=y_in, stack="总量")
    .add_yaxis(series_name="支出", y_axis=y_out, stack="总量")
    .set_global_opts(yaxis_opts=opts.AxisOpts(type_="value"))
    .render("bar_waterfall_plot.html")
)
