scipy.optimize.curve_fit 拟合多维曲面问题
在做模板匹配算法过程中,想要通过拟合高斯曲面的方式实现亚像素精度。初始代码如下
# 创建一个函数模型用来生成数据
    def func1(x, a, b, c, d):
        r = a * np.exp(-((x[0] - b) ** 2 + (x[1] - d) ** 2) / (2 * c ** 2))
        return r

    # 生成原始数据
    x1 = np.linspace(0, 10, 10).reshape(1, -1)
    x2 = np.linspace(0, 10, 10).reshape(1, -1)

    x = np.append(x1, x2, axis=0)
    X, Y = np.meshgrid(x1, x2)
    XX = np.expand_dims(X, 0)
    YY = np.expand_dims(Y, 0)
    xx = np.append(XX, YY, axis=0)

    y = func1(xx, 10, 5, 2, 5)
    # 对原始数据增加噪声
    yn = y + 0.002 * np.random.normal(size=xx.shape[1])

    # 使用curve_fit函数拟合噪声数据
    t0 = timeit.default_timer()
    popt, pcov = curve_fit(func1, xx, yn)
    elapsed = timeit.default_timer() - t0
    print('Time: {} s'.format(elapsed))

    # popt返回最拟合给定的函数模型func的参数值
    print(popt)
结果在执行
popt, pcov = curve_fit(func1, xx, yn)时报错
 File "D:\ProgramData\Anaconda3\envs\vis\lib\site-packages\scipy\optimize\minpack.py", line 763, in curve_fit
    res = leastsq(func, p0, Dfun=jac, full_output=1, **kwargs)
  File "D:\ProgramData\Anaconda3\envs\vis\lib\site-packages\scipy\optimize\minpack.py", line 401, in leastsq
    gtol, maxfev, epsfcn, factor, diag)
minpack.error: Result from function call is not a proper array of floats.
查看scipy的文档scipy.optimize.curve_fit 文档可知,
xdata array_like or object
The independent variable where the data is measured. Should usually be an M-length sequence or an (k,M)-shaped array for functions with k predictors, but can actually be any object.
ydata array_like
The dependent data, a length M array - nominally
f(xdata, ...).
代码中定义的fun1函数是直接把高斯曲面的值返回了,是一个二维数组,而文档中明确指明ydata是长度为M的array,即一维数组。为解决这一问题,使用numpy的ravel方法将返回值拉伸为一维数组即可。
完整代码如下:
# 创建一个函数模型用来生成数据
    def func1(x, a, b, c, d):
        r = a * np.exp(-((x[0] - b) ** 2 + (x[1] - d) ** 2) / (2 * c ** 2))
        return r.ravel()

    # 生成原始数据
    x1 = np.linspace(0, 10, 10).reshape(1, -1)
    x2 = np.linspace(0, 10, 10).reshape(1, -1)
    x = np.append(x1, x2, axis=0)
    X, Y = np.meshgrid(x1, x2)
    XX = np.expand_dims(X, 0)
    YY = np.expand_dims(Y, 0)
    xx = np.append(XX, YY, axis=0)
    y = func1(xx, 10, 5, 2, 5)
    # 对原始数据增加噪声
    yn = y + 0.002 * np.random.normal(size=xx.shape[1] * xx.shape[2])

    # 使用curve_fit函数拟合噪声数据
    t0 = timeit.default_timer()
    popt, pcov = curve_fit(func1, xx, yn)
    elapsed = timeit.default_timer() - t0
    print('Time: {} s'.format(elapsed))

    # popt返回最拟合给定的函数模型func的参数值
    print(popt)

    fig = plt.figure('拟合图')
    ax = Axes3D(fig)
    X, Y = np.meshgrid(x1, x2)
    XX = np.expand_dims(X, 0)
    YY = np.expand_dims(Y, 0)
    xx = np.append(XX, YY, axis=0)
    R = func1(xx, *popt)
    # R, _ = np.meshgrid(R, x1)
    # y = func1(xx, 10, 5, 2, 5)
    # # 对原始数据增加噪声
    # yn = y + 0.002 * np.random.normal(size=xx.shape[1] * xx.shape[2])
    R = R.reshape(10, 10)
    yn = yn.reshape(10, 10)
    ax.plot_surface(X, Y, R, rstride=1, cstride=1, cmap='rainbow')
    ax.plot_surface(X, Y, yn, rstride=1, cstride=1, color='red')

    plt.show()
    y_predict_1 = func1(x, *popt)
    indexes_1 = getIndexes(y_predict_1, yn)
    print(indexes_1)
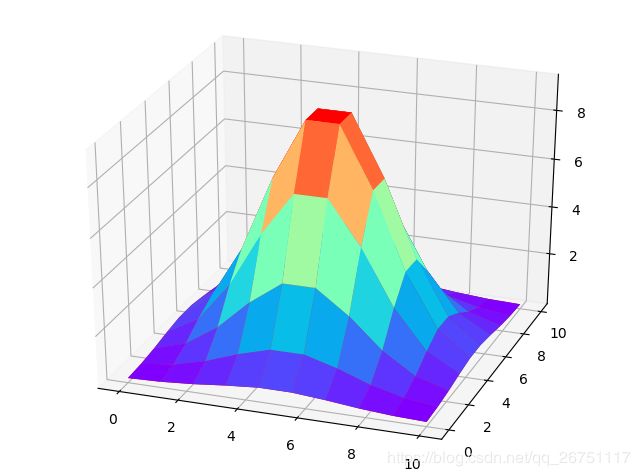
生成的拟合曲面如图
