信号系统小实验
- 1.利用MATLAB产生下列连续信号并作图
- 2.在计算机屏幕上画出周期信号的时域波形
- 2.1周期矩形脉冲信号波形
- 2.2周期锯齿脉冲信号波形
- 2.3周期三角脉冲信号
- 2.4周期半波余弦信号
- 3.分别计算出5、10、15次谐波迭加的值
- 4.产生基本离散信号、绘制信号波形、实现信号的基本运算特别是卷积和的运算
1.利用MATLAB产生下列连续信号并作图

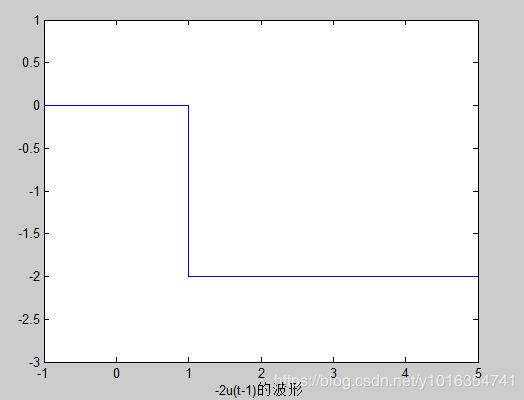
t=-1:0.002:5
t0=1
x=stepfun(t,t0)
y=-2*x
plot(t,y)
axis([-1 5 -3 1])
xlabel('-2u(t-1)的波形')

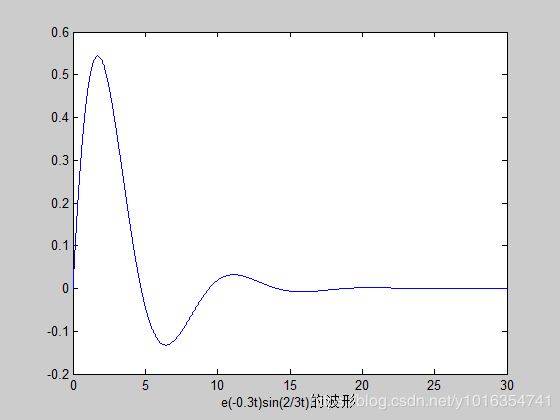
t=0:0.0001:30
x=exp(-0.3*t).*sin((2/3)*t)
plot(t,x)
xlabel('e(-0.3t)sin(2/3t)的波形')

t=-0.1:0.0001:0.1
x=cos(100*t)+cos(300*t)
plot(t,x)
axis([-0.1 0.1 -3 3])
xlabel('cos(100t)+cos(300t)的波形')

2.在计算机屏幕上画出周期信号的时域波形
2.1周期矩形脉冲信号波形
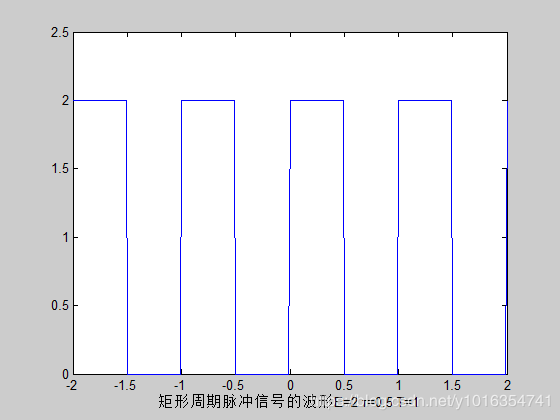
f0=1;
t=-2:0.01:2
wc=2*pi*f0
s=square(wc*t,50)+1
plot(t,s)
axis([-2,2,0,2.5])
xlabel('矩形周期脉冲信号的波形E=2 τ=0.5 T=1')
2.2周期锯齿脉冲信号波形
t=-5:0.001:5
w=2*pi*1
f=sawtooth(w*t,1)+1
plot(t,f)
axis([-5 5 0 2.5])
xlabel('周期锯齿脉冲信号波形E=2 T=1')

2.3周期三角脉冲信号
t=-5:0.001:5
w=2*pi*1
f=sawtooth(w*t,0.5)+1
plot(t,f)
axis([-5 5 0 2.5])
xlabel('周期三角脉冲信号波形E=2 T=1')

2.4周期半波余弦信号
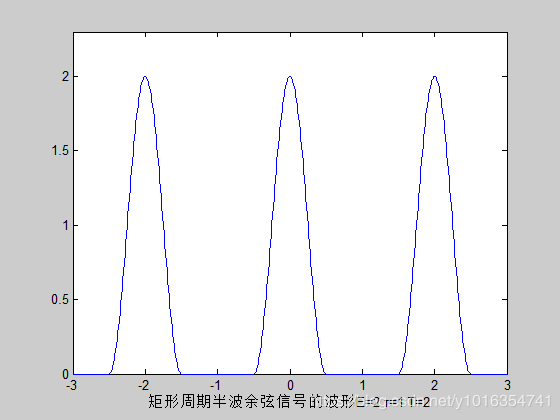
f0=1;
t=-5:0.01:5
wc=2*pi*f0
y1=cos(wc*t)+1
y2=(square(wc/2*(t+0.5),50)+1)/2
y=y1.*y2
plot(t,y)
axis([-3,3,0,2.3])
xlabel('矩形周期半波余弦信号的波形E=2 τ=1 T=2')
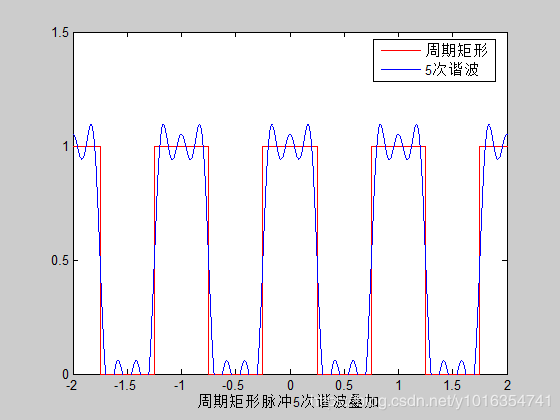
3.分别计算出5、10、15次谐波迭加的值
t=-5:0.001:5
f0=1
w=2*pi*f0;
y=0.5*square(w*(t+1/4),50)+0.5;
Y=1/2;
N=input('谐波次数N=');
for n=1:N
Y=Y+sinc(n*0.5)*cos(n*w*t); end
plot(t,y, ' r', t,Y, ' b');
axis([-2,2,0,1.5]);
xlabel('周期矩形脉冲5次谐波叠加')
legend('周期矩形','5次谐波',0)
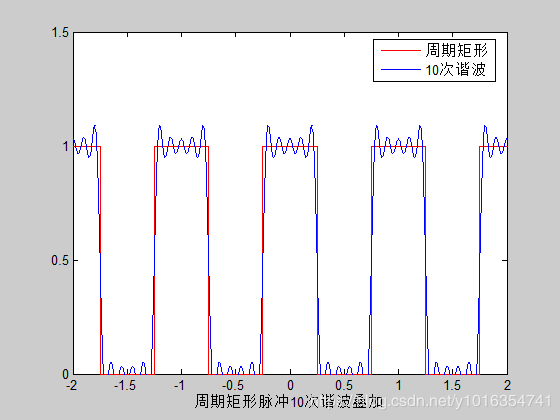
t=-5:0.001:5
f0=1
w=2*pi*f0;
y=0.5*square(w*(t+1/4),50)+0.5;
Y=1/2;
N=input('谐波次数N=');
for n=1:N
 Y=Y+sinc(n*0.5)*cos(n*w*t); end
plot(t,y, ' r', t,Y, ' b');
axis([-2,2,0,1.5]);
xlabel('周期矩形脉冲10次谐波叠加')
legend('周期矩形','10次谐波',0)
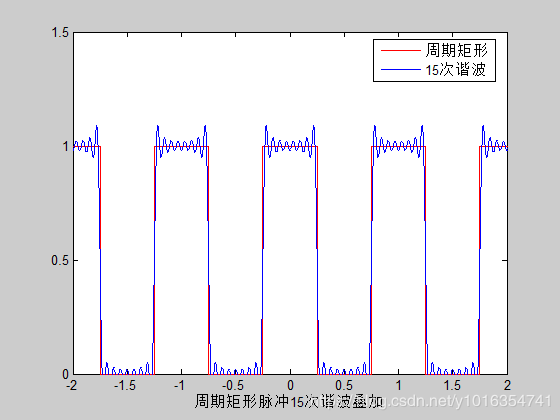
t=-5:0.001:5
f0=1
w=2*pi*f0;
y=0.5*square(w*(t+1/4),50)+0.5;
Y=1/2;
N=input('谐波次数N=');
for n=1:N
 Y=Y+sinc(n*0.5)*cos(n*w*t); end
plot(t,y, ' r', t,Y, ' b');
axis([-2,2,0,1.5]);
xlabel('周期矩形脉冲15次谐波叠加')
legend('周期矩形','15次谐波',0)
t=-2:0.0001:2;
f0=1
w=2*pi*f0;
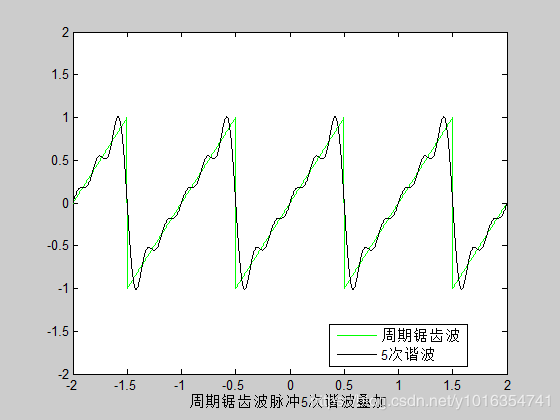
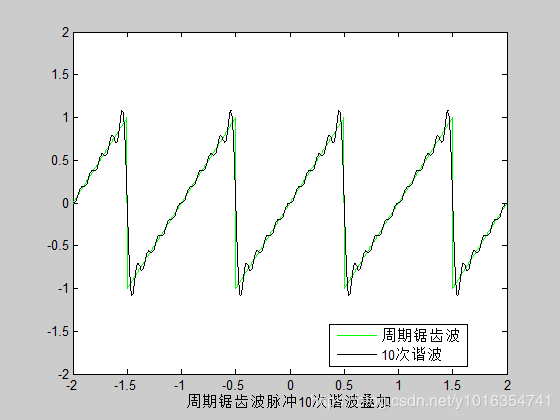
y=sawtooth(w*(t+0.5),1);
N=input('请输入谐波次数N=');
Y=0;
for n=1:N
 	Y=Y+2/pi*((-1)^(n+1))*(1/n)*sin(n*w*t);
end
plot(t,y, ' G', t,Y, ' K');
axis([-2,2,-2,2]);
xlabel('周期锯齿波脉冲5次谐波叠加')
legend('周期锯齿波','5次谐波',0)
t=-2:0.0001:2;
f0=1
w=2*pi*f0;
y=sawtooth(w*(t+0.5),1);
N=input('请输入谐波次数N=');
Y=0;
for n=1:N
	Y=Y+2/pi*((-1)^(n+1))*(1/n)*sin(n*w*t);
end
plot(t,y, ' G', t,Y, ' K');
axis([-2,2,-2,2]);
xlabel('周期锯齿波脉冲10次谐波叠加')
legend('周期锯齿波','10次谐波',0)
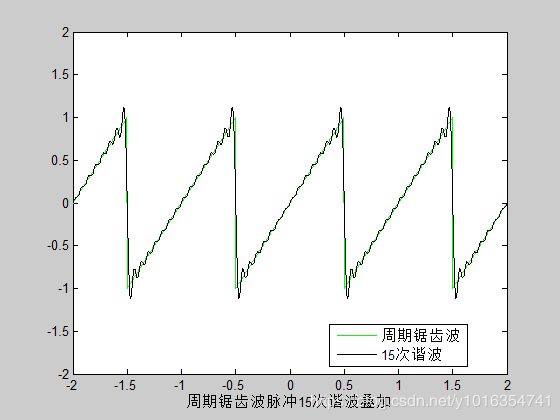
t=-2:0.0001:2;
f0=1
w=2*pi*f0;
y=sawtooth(w*(t+0.5),1);
N=input('请输入谐波次数N=');
Y=0;
for n=1:N
	Y=Y+2/pi*((-1)^(n+1))*(1/n)*sin(n*w*t);
end
plot(t,y, ' G', t,Y, ' K');
axis([-2,2,-2,2]);
xlabel('周期锯齿波脉冲15次谐波叠加')
legend('周期锯齿波','15次谐波',0)
t=-2:0.0001:2;
f0=1
w=2*pi*f0;
y=sawtooth(w*(t+0.5),0.5);
N=input('谐波次数N=');
Y=0;
for n=1:N
	 Y=Y+8/(pi^2)*1/(n^2)*sin(n*pi/2)^2*cos(n*w*t);;
end
plot(t,y, ' G', t,Y, ' K');
axis([-2,2,-2,2]);
xlabel('周期三角波脉冲5次谐波叠加')
legend('周期三角波','5次谐波',0)
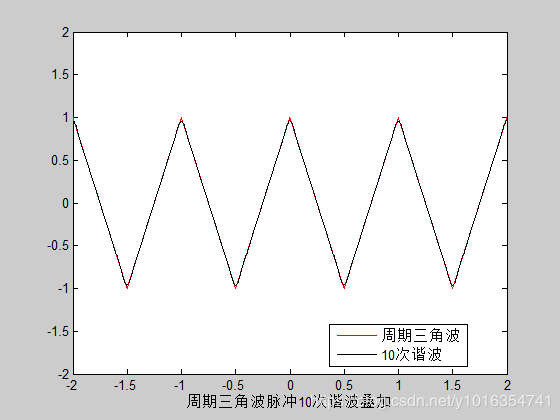
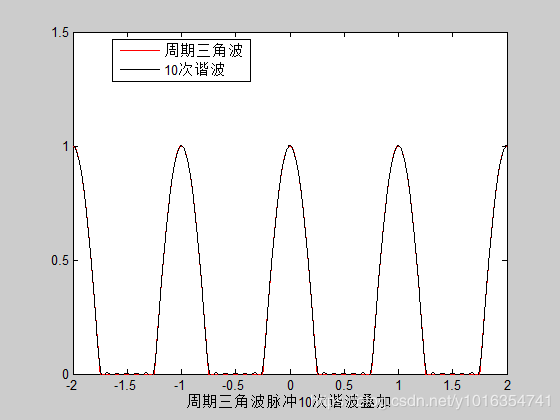
t=-2:0.0001:2;
f0=1
w=2*pi*f0;
y=sawtooth(w*(t+0.5),0.5);
N=input('谐波次数N=');
Y=0;
for n=1:N
	Y=Y+8/(pi^2)*1/(n^2)*sin(n*pi/2)^2*cos(n*w*t);;
end
plot(t,y, ' G', t,Y, ' K');
axis([-2,2,-2,2]);
xlabel('周期三角波脉冲10次谐波叠加')
legend('周期三角波','10次谐波',0)
t=-2:0.0001:2;
f0=1
w=2*pi*f0;
y=sawtooth(w*(t+0.5),0.5);
N=input('谐波次数N=');
Y=0;
for n=1:N
	Y=Y+8/(pi^2)*1/(n^2)*sin(n*pi/2)^2*cos(n*w*t);;
end
plot(t,y, ' G', t,Y, ' K');
axis([-2,2,-2,2]);
xlabel('周期三角波脉冲15次谐波叠加')
legend('周期三角波','15次谐波',0)


t=-2:0.001:2;
f0=1
w=2*pi*f0;
y1=cos(w*t);
y2=0.5*square(w*(t+0.25),50)+0.5;
y=y1.*y2;
Y=1/pi+1/2*cos(w*t);
N=input('请输入谐波次数N=');
for n=2:N
	Y=Y-2/pi*1/(n^2-1)*cos(n*pi/2)*cos(n*w*t);
end
plot(t,y, ' R', t,Y, ' K');
axis([-2,2,0,1.5]);
xlabel('周期三角波脉冲5次谐波叠加')
legend('周期三角波','5次谐波',0)
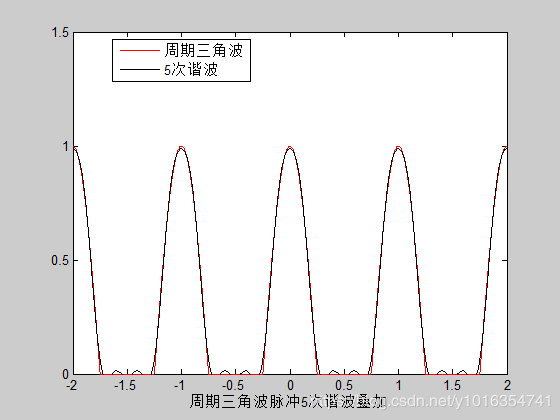
t=-2:0.001:2;
f0=1
w=2*pi*f0;
y1=cos(w*t);
y2=0.5*square(w*(t+0.25),50)+0.5;
y=y1.*y2;
Y=1/pi+1/2*cos(w*t);
N=input('请输入谐波次数N=');
for n=2:N
	Y=Y-2/pi*1/(n^2-1)*cos(n*pi/2)*cos(n*w*t);
end
plot(t,y, ' R', t,Y, ' K');
axis([-2,2,0,1.5]);
xlabel('周期三角波脉冲10次谐波叠加')
legend('周期三角波','10次谐波',0)
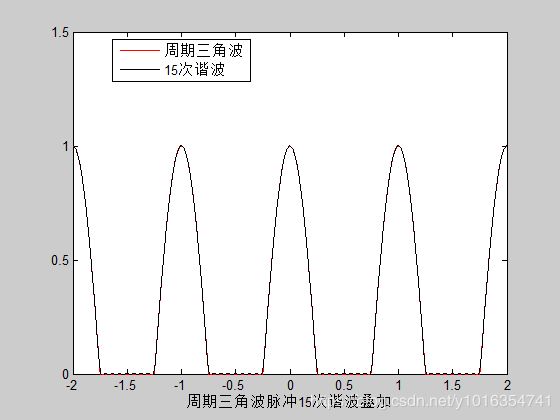
t=-2:0.001:2;
f0=1
w=2*pi*f0;
y1=cos(w*t);
y2=0.5*square(w*(t+0.25),50)+0.5;
y=y1.*y2;
Y=1/pi+1/2*cos(w*t);
N=input('请输入谐波次数N=');
for n=2:N
	Y=Y-2/pi*1/(n^2-1)*cos(n*pi/2)*cos(n*w*t);
end
plot(t,y, ' R', t,Y, ' K');
axis([-2,2,0,1.5]);
xlabel('周期三角波脉冲15次谐波叠加')
legend('周期三角波','15次谐波',0)
4.产生基本离散信号、绘制信号波形、实现信号的基本运算特别是卷积和的运算
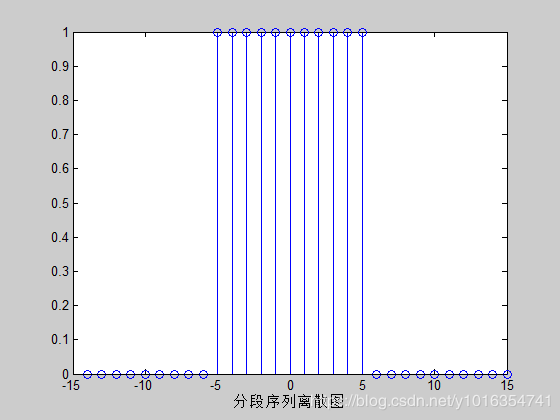
k=-14:15
x=[zeros(1,9),ones(1,11),zeros(1,10)]
stem(k,x)
xlabel('分段序列离散图')
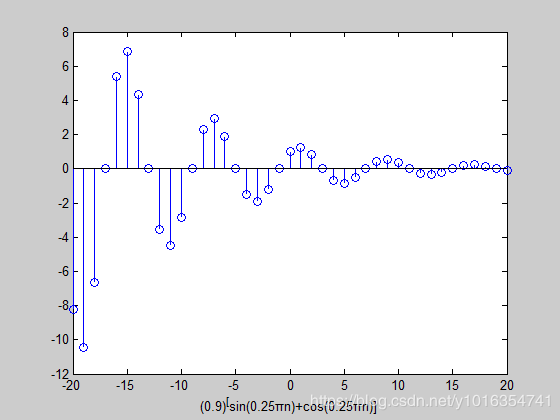
k=-20:20;
omega=pi/4;
x=(0.9).^k.*(sin(omega.*k)+cos(omega.*k))
stem(k,x)
xlabel('(0.9)^[sin(0.25πn)+cos(0.25πn)]')
x=[1,2,0,-1,3,2]
h=[1,-1,1]
y=conv(x,h)
stem([0:length(y)-1],y)
xlabel('求卷积和')

- 欢迎关注微信公众号【电子物语】,有更多好玩的文章等着你 !


