Python网络爬虫之中国天气网
大家好,今天我们来讲讲怎么用python对中国天气网进行爬取并且对爬取到的数据进行数据可视化的显示
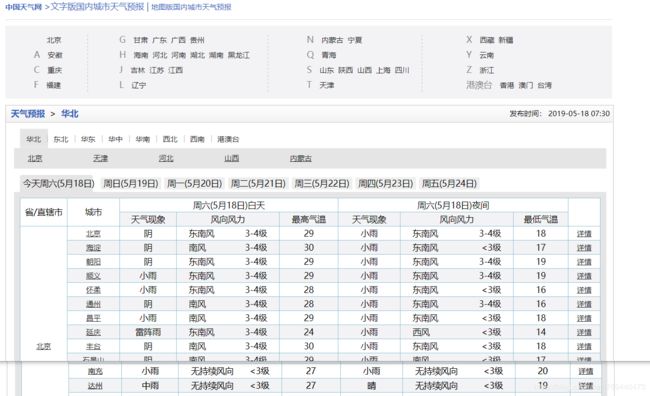
这就是我们今天要爬取的内容,将中国天气网上的华北、东北等地区七天内的天气数据进行一个爬取,并且对最高气温和最低气温的各个城市进行数据可视化
我们由网页可以看出这里是没有运用ajax等加载技术的,这样比较方便我们一个爬虫新手对其进行爬取,在爬取过程中只需要对一些文本进行格式化就行
import requests
from bs4 import BeautifulSoup
from lxml import html

from pyecharts.charts import Bar

#定义两个全局变量,对于最冷温度城市和最热温度城市进行一个放入
All_MinData = []
All_MaxData = []

def parse_page(url):
    header = {
        'User-Agent': 'Mozilla/5.0 (Windows NT 10.0; Win64; x64) AppleWebKit/537.36 (KHTML, like Gecko) Chrome/70.0.3538.77 Safari/537.36',
        #'Referer': 'http://www.weather.com.cn/textFC/hb.shtml'
    }
    response = requests.get(url=url, headers=header)
    text = response.content.decode('utf-8')
    soup = BeautifulSoup(text,'lxml')
    tables = soup.find_all('table')[5:]
    for table in tables:
        trs = table.find_all('tr')[3:]    #[2:]对进行筛选
        for tr in trs:    # 打印北京这个区块下面市区的天气情况
            tds = tr.find_all('td')
            city_td = tds[0]                     # stripped_strings这个方法可以对文本中的空格行进行删除只提取出其中的文字信息
            city = list(city_td.stripped_strings)[0]     #获取城市的名字

            weather_td = tds[1]
            cityweather = list(weather_td.stripped_strings)[0]  #获取天气的现象


            mintempl_td = tds[-2]
            min_templ = list(mintempl_td.stripped_strings)[0]   #获取最低的温度

            maxteml_td = tds[-5]
            max_templ = list(maxteml_td.stripped_strings)[0]  # 获取最高的温度
            All_MinData.append({"city":city,"min_templ":int(min_templ)})
            All_MaxData.append({"city": city, "max_templ": int(max_templ)})


            print({"city":city,"cityweather":cityweather,"max_templ":max_templ,"min_templ":min_templ})


def main():
    urls ={
        'http://www.weather.com.cn/textFC/hb.shtml',
        'http://www.weather.com.cn/textFC/db.shtml',
        'http://www.weather.com.cn/textFC/hd.shtml',
        'http://www.weather.com.cn/textFC/hz.shtml',
        'http://www.weather.com.cn/textFC/hn.shtml',
        'http://www.weather.com.cn/textFC/xb.shtml',
        'http://www.weather.com.cn/textFC/xn.shtml'
    }
    for url in urls:
        parse_page(url)


    All_MinData.sort(key=lambda data:data['min_templ'])
    print(All_MinData)
    mindata = All_MinData[0:10]

    All_MaxData.sort(key=lambda data: data['max_templ'],reverse=True)
    print(All_MaxData)
    maxdata = All_MaxData[0:10]

    mincity = list(map(lambda x:x['city'],mindata))
    mintempl = list(map(lambda x:x['min_templ'],mindata))
    maxcity = list(map(lambda y:y['city'],maxdata))
    maxtempl = list(map(lambda y:y['max_templ'],maxdata))


    minchart = Bar()
    maxchart = Bar()


    minchart.add_xaxis(mincity)                   #导入pyecharts中的Bar柱状图生成数据
    minchart.add_yaxis("中国天气最高气温排行榜", mintempl)
    minchart.render('cooltemperature.html')


    maxchart.add_xaxis(maxcity)
    maxchart.add_yaxis("中国天气最高气温排行榜", maxtempl)
    maxchart.render('hottemperature.html')

if __name__ == '__main__':
    main()
这里就是小编所写的代码,因为每个省份的第一个数据不好进行修改,所以我直接从第二个城市进行选择,这里面用到的几个库pyechart还有requests库都需要自己pip一下。

