指针与仪表盘自动识别
利用传统的计算机视觉方法识别仪表盘中的指针
参考链接
-
yolov3原理和实现参考上篇博客
首先基于yolov3定位出仪表盘的位置,然后剪切仪表盘进行下一步的分析。 -
yolov3检测的IOU可能不是很精准接下来利用霍夫圆检测定位出仪表盘。
-
检测圆后剪裁感兴趣的区域ROI。
-
在没有检测到圆的情况下通过剪裁yoloV3检测到的图片中的位置来按照左右比例剪裁感兴趣范围
-
使用二值化以及腐蚀和膨胀等操作去除噪音。
-
二值化和去噪音后的图片按照轮廓面积降噪排序,选择面积最大的作为指针部分。
-
绘制指针的最小外接矩形,旋转矩形让长边处于竖直状态,按照长边将矩形切成等长的两份,分别计算每一份的面积,以较小份的面积作为指针的针头。
-
获取指针的位置后按照事先标定的指针的刻度进行计算(PS:每个表盘被拍到的时候都是竖直放置,因此刻度的起点和终点的位置基本上不会发生改变)
以下是实现方式中的部分方法的原理和实现过程。
图片的腐蚀和膨胀
参考链接以及官方接口文档
-
腐蚀
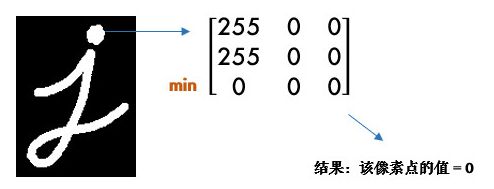
腐蚀的效果是把图片”变瘦”,其原理是在原图的小区域内取局部最小值。因为是二值化图,只有0和255,所以小区域内有一个是0该像素点就为0:

这样原图中边缘地方就会变成0,达到了瘦身目的
OpenCV中用cv2.erode()函数进行腐蚀,只需要指定核的大小就行:import cv2 import numpy as np img = cv2.imread('j.bmp', 0) kernel = np.ones((5, 5), np.uint8) erosion = cv2.erode(img, kernel) # 腐蚀
这个核也叫结构元素,因为形态学操作其实也是应用卷积来实现的。结构元素可以是矩形/椭圆/十字形,可以用cv2.getStructuringElement()来生成不同形状的结构元素,比如:
kernel = cv2.getStructuringElement(cv2.MORPH_RECT, (5, 5))  # 矩形结构
kernel = cv2.getStructuringElement(cv2.MORPH_ELLIPSE, (5, 5))  # 椭圆结构
kernel = cv2.getStructuringElement(cv2.MORPH_CROSS, (5, 5))  # 十字形结构
-
膨胀
膨胀与腐蚀相反,取的是局部最大值,效果是把图片"变胖":dilation = cv2.dilate(img, kernel) # 膨胀 import cv2 import numpy as np img = cv2.imread('j.bmp', 0) kernel = np.ones((5, 5), np.uint8) erosion = cv2.dilate(img, kernel) # 腐蚀 -
开/闭运算
先腐蚀后膨胀叫开运算(因为先腐蚀会分开物体,这样容易记住),其作用是:分离物体,消除小区域。这类形态学操作用cv2.morphologyEx()函数实现:kernel = cv2.getStructuringElement(cv2.MORPH_RECT, (5, 5)) # 定义结构元素 img = cv2.imread('j_noise_out.bmp', 0) opening = cv2.morphologyEx(img, cv2.MORPH_OPEN, kernel) # 开运算闭运算则相反:先膨胀后腐蚀(先膨胀会使白色的部分扩张,以至于消除/"闭合"物体里面的小黑洞,所以叫闭运算)
 img = cv2.imread('j_noise_in.bmp', 0)
 closing = cv2.morphologyEx(img, cv2.MORPH_CLOSE, kernel)  # 闭运算
霍夫直线检测
对于图像来说可以从笛卡尔坐标系统转换到霍夫空间,对于一条直线来说
在笛卡尔坐标系统中表示一条直线有两个参数斜率k与截距b
在霍夫空间中表示一条直线也有两个参数到原点的距离d与角度theta

对于图像上的每一个点(x0, y0)都有 r θ = x 0 c o s θ + y 0 s i n θ r_\theta = x_0cos\theta + y_0sin\theta rθ=x0cosθ+y0sinθ
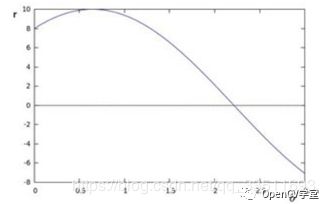
对于给定任意theta值,都有一个r与之对应,对于点x0=8, y0=6,在霍夫空间有如下的曲线:

当有很多点在霍夫空间的曲线相交于一点时候

就说明这些点具有相同的theta与r,即它们都属于同一条直线,而参数theta与r就是该直线在霍夫空间的直线参数方程。
总的来说霍夫变换(Hough Transform)是图像处理中的一种特征提取技术,它通过一种投票算法检测具有特定形状的物体。该过程在一个参数空间中通过计算累计结果的局部最大值得到一个符合该特定形状的集合作为霍夫变换结果
cv2.HoughLines()函数是在二值图像中查找直线,cv2.HoughLinesP()函数可以查找直线段。
HoughLinesP(image, rho, theta, threshold, lines=None, minLineLength=None, maxLineGap=None)
其中:
image: 必须是二值图像,推荐使用canny边缘检测的结果图像;

rho: 线段以像素为单位的距离精度,double类型的,推荐用1.0

theta: 线段以弧度为单位的角度精度,推荐用numpy.pi/180

threshod: 累加平面的阈值参数,int类型,超过设定阈值才被检测出线段,值越大,基本上意味着检出的线段越长,检出的线段个数越少。根据情况推荐先用100试试

lines:这个参数的意义未知,发现不同的lines对结果没影响,但是不要忽略了它的存在

minLineLength:线段以像素为单位的最小长度,根据应用场景设置

maxLineGap:同一方向上两条线段判定为一条线段的最大允许间隔(断裂),超过了设定值,则把两条线段当成一条线段,值越大,允许线段上的断裂越大,越有可能检出潜在的直线段
霍 夫 直 线 检 测 中 的 代 码 示 例 \color{blue}霍夫直线检测中的代码示例 霍夫直线检测中的代码示例
import cv2
import numpy as np
img = cv2.imread('02.jpg')
gray = cv2.cvtColor(img, cv2.COLOR_BGR2GRAY)
gaus = cv2.GaussianBlur(gray,(3,3),0)
edges = cv2.Canny(gaus, 50, 150, apertureSize=3)
minLineLength = 100
maxLineGap = 10
lines = cv2.HoughLinesP(edges, 1, np.pi / 180, 100, minLineLength, maxLineGap)
for x1, y1, x2, y2 in lines[0]:
    cv2.line(img, (x1, y1), (x2, y2), (0, 255, 0), 2)
cv2.imshow("houghline",img)
cv2.waitKey()
cv2.destroyAllWindows()
霍夫圆检测的基本原理:
霍夫圆变换的基本思路是认为图像上每一个非零像素点都有可能是一个潜在的圆上的一点,跟霍夫线变换一样,也是通过投票,生成累积坐标平面,设置一个累积权重来定位圆。
在笛卡尔坐标系中圆的方程为:
( x − a ) 2 + ( y − b ) 2 = r 2 (x - a)^2 + (y - b)^2 = r^2 (x−a)2+(y−b)2=r2
其中(a,b)是圆心,r是半径。
在笛卡尔的xy坐标系中经过某一点的所有圆映射到abr坐标系中就是一条三维的曲线:
经过xy坐标系中所有的非零像素点的所有圆就构成了abr坐标系中很多条三维的曲线。
在xy坐标系中同一个圆上的所有点的圆方程是一样的,它们映射到abr坐标系中的是同一个点,所以在abr坐标系中该点就应该有圆的总像素N0个曲线相交.
通过判断abr中每一点的相交(累积)数量,大于一定阈值的点就认为是圆。
问 题 是 \color{red}问题是 问题是它的累加到一个三维的空间,意味着比霍夫线变换需要更多的计算消耗。
Opencv霍夫圆变换对标准霍夫圆变换做了运算上的优化。
它采用的是“霍夫梯度法”。它的检测思路是去遍历累加所有非零点对应的圆心,对圆心进行考量。
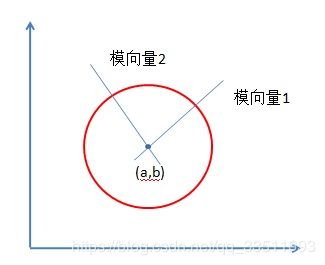
如何定位圆心呢?圆心一定是在圆上的每个点的模向量上,即在垂直于该点并且经过该点的切线的垂直线上,这些圆上的模向量的交点就是圆心。
霍夫梯度法就是要去查找这些圆心,根据该“圆心”上模向量相交数量的多少,根据阈值进行最终的判断。

在 实 际 的 应 用 中 由 于 图 片 存 在 噪 音 容 易 影 响 到 霍 夫 圆 检 测 的 效 果 , 一 般 在 霍 夫 圆 检 测 之 前 对 图 片 进 行 中 值 加 高 斯 滤 波 滤 波 器 进 行 调 整 后 再 进 行 霍 夫 圆 检 测 \color{red}在实际的应用中由于图片存在噪音容易影响到霍夫圆检测的效果,一般在霍夫圆检测之前对图片进行中值加高斯滤波滤波器进行调整后再进行霍夫圆检测 在实际的应用中由于图片存在噪音容易影响到霍夫圆检测的效果,一般在霍夫圆检测之前对图片进行中值加高斯滤波滤波器进行调整后再进行霍夫圆检测
霍夫圆检测具体的实现函数cv2.HoughCircles
cv2.HoughCircles(image, method, dp, minDist, circles=None, param1=None, param2=None, minRadius=None, maxRadius=None)
其中:
image:8位,单通道图像。如果使用彩色图像,需要先转换为灰度图像。

method:定义检测图像中圆的方法。目前唯一实现的方法是cv2.HOUGH_GRADIENT。

dp:累加器分辨率与图像分辨率的反比。dp获取越大,累加器数组越小。

minDist:检测到的圆的中心,(x,y)坐标之间的最小距离。如果minDist太小,则可能导致检测到多个相邻的圆。如果minDist太大,则可能导致很多圆检测不到。

param1:用于处理边缘检测的梯度值方法。

param2:cv2.HOUGH_GRADIENT方法的累加器阈值。阈值越小,检测到的圈子越多。

minRadius:半径的最小大小(以像素为单位)。

maxRadius:半径的最大大小(以像素为单位)。
仪 表 盘 检 测 中 使 用 的 圆 检 测 \color{blue}仪表盘检测中使用的圆检测 仪表盘检测中使用的圆检测
def detect_circles(image):
   dst =  Gaussian(median(image, 9), 15)
   picture = cv2.cvtColor(dst, cv2.COLOR_RGB2GRAY)
   edges = cv2.Canny(picture, 50, 120)
   cv2.imshow("edges", edges)
   circles = cv2.HoughCircles(edges, cv2.HOUGH_GRADIENT, 1, 100, param1=100, param2=30, minRadius=10)
   print("circles", circles)
   if circles is not None:
       print("circles is not None")
       circles = np.uint16(np.around(circles))[0, :]
       circles = sorted(circles, key=(lambda x: x[2]), reverse=True)
       w, h, d = image.shape
       print("circle", w, h)
       max_area = 0
       threshold= float(w * 0.15)
       for circle in circles:
           min_width = float(float(circle[2]) - float(circle[0]))
           max_width = float(float(circle[2]) + float(circle[0]))
           min_height = float(float(circle[2]) - float(circle[1]))
           max_height = float(float(circle[2]) + float(circle[1]))
           print("distance_jude", min_width, max_width, min_height, max_height)
           if min_width + threshold < 0:
               min_width = 0
           if max_width - threshold > w:
               min_width = w
           if min_height + threshold < 0:
               min_height = 0
           if max_height - threshold > h:
               max_height = h
           circle_area = abs(max_height - min_height) *abs(max_width - min_width)
           if circle_area > max_area:
               max_area = circle_area
               single_circle = circle
       if float(max_area / float(w * h)) > 0.4:
           circle = single_circle
           cv2.circle(image, (circle[0], circle[1]), circle[2], (0, 0, 255), 2)  #画圆
           cv2.circle(image, (circle[0], circle[1]), 2, (0, 0, 255), 2)  #画圆心
           cv2.imshow("circles", image)
       else:
           circle = None
       return circle
滤波器
def bi_demo(image):      #双边滤波
return cv2.bilateralFilter(image, 9,75,75)

def shift_demo(image):   #均值迁移
    dst = cv2.pyrMeanShiftFiltering(image, 10, 50)
    cv2.imshow("shift_demo", dst)

def blur(img): #均值滤波
    return cv2.blur(img, (5,5))

def median(img, size): # 中值滤波
    return cv2.medianBlur(img, size)

def Gaussian(img, size):  #高斯滤波
    return cv2.GaussianBlur(img,(size,size),0)

def board_detect(img): # 高通滤波用于边缘检测
    x=cv2.Sobel(img,cv2.CV_16S,1,0)
    y=cv2.Sobel(img,cv2.CV_16S,0,1)
    absx=cv2.convertScaleAbs(x)
    absy=cv2.convertScaleAbs(y)
    return cv2.addWeighted(absx,0.5,absy,0.5,0)
连通域
在计算连通域之前可以对图片进行部分处理如去除噪音裁剪感兴趣区域,图像灰度化和二值化。最大连通域中一般使用查找轮廓的函数cv2.findContours()
该函数有 三个输入参数:输入图像(二值图像),轮廓检索方式,轮廓近似方法
-
轮廓检索方式
cv2.RETR_EXTERNAL 只检测外轮廓 cv2.RETR_LIST 检测的轮廓不建立等级关系 cv2.RETR_CCOMP 建立两个等级的轮廓,上面一层为外边界,里面一层为内孔的边界信息 cv2.RETR_TREE 建立一个等级树结构的轮廓 -
轮廓近似办法
 cv2.CHAIN_APPROX_NONE	存储所有边界点
 cv2.CHAIN_APPROX_SIMPLE	压缩垂直、水平、对角方向,只保留端点
 cv2.CHAIN_APPROX_TX89_L1	使用teh-Chini近似算法
 cv2.CHAIN_APPROX_TC89_KCOS	使用teh-Chini近似算法
仪 表 盘 中 找 到 最 大 的 连 通 域 \color{blue}仪表盘中找到最大的连通域 仪表盘中找到最大的连通域
def get_pointer_contour(img):
    """
    通过轮廓提取指针区域
    :param img: 二值图
    :return: 指针区域二值图,指针区域轮廓坐标
    """
    ## 查找二值图中的轮廓,按轮廓面积降序排序
    # _, cnts, _ = cv2.findContours(img, cv2.RETR_EXTERNAL, cv2.CHAIN_APPROX_NONE)
    # cv2.drawContours(img, cnts, -1, 255, 3)
    cv2.namedWindow("img", 0)
    cv2.imshow("img", img)
    print(img.shape)
    _, cnts, hierarchy = cv2.findContours( img,  cv2.RETR_EXTERNAL,  cv2.CHAIN_APPROX_NONE)
    print("len(cnts)", len(cnts))
    cv2.drawContours(img, cnts, -1, 255, 3)
    cv2.namedWindow("cnts", 0)
    cv2.imshow("cnts", img)
    cnts.sort(reverse=True, key=cv2.contourArea)
    ## 理想情况下指针区域的轮廓面积最大,压力表指针可能因为腐蚀操作变成两段,所以对前两个区域进行条件筛选
    areas = [cv2.contourArea(cnt) for cnt in cnts]
    print("areas", areas)
    h, w = img.shape
    print("h_w", h, w)
    if len(cnts) >= 2 and areas[0] / (areas[1] + 0.000000000001) < 5:
        cnts = [cnts[0], cnts[1]]
        if len(cnts) >= 3 and areas[1] / (areas[2] + 0.0000000001) < 20:
            cnts = [cnts[0]]
    else:
        cnts = [cnts[0]]
    ## 保留指针区域,去掉其他区域
    if len(cnts) >=2:
        print("slope", slope(cnts[0]), slope(cnts[1]))
        if abs(slope(cnts[0])- slope(cnts[1])) < 0.4 and  slope(cnts[0]) * slope(cnts[1]) > 0: #判断两个区域内点组成的直线方程的斜率
            cnts = [cnts[0], cnts[1]]
        else:
            cnts = [cnts[0]]
    contour = np.zeros_like(img)
    cv2.drawContours(contour, cnts, -1, 255, thickness=-1)
    cv2.namedWindow("contour", 0)
    cv2.imshow("contour", contour)
    # cv2.waitKey(0)
    return contour, cnts
$\color{blue}表盘中根据刻度尺的大小长宽比例等条件利用连通域进行筛选
def get_rule(img):
    img_copy = img.copy()
    image = cv2.cvtColor(img_copy, cv2.COLOR_BGR2GRAY)
    ret, frame = cv2.threshold(image, 50, 255, cv2.THRESH_BINARY_INV + cv2.THRESH_OTSU)
    _, cnts, hierarchy = cv2.findContours(frame, cv2.RETR_EXTERNAL, cv2.CHAIN_APPROX_NONE)
    cv2.drawContours(img, cnts, -1, 255, 3)
    cv2.namedWindow("cnts", 0)
    cv2.imshow("cnts", img)
    cnts.sort(reverse=True, key=cv2.contourArea)
    remain_cnts = []
    for cnt in cnts: # 将连通域用外接最小矩形框起来,并根据矩形的大小,长和宽的大小以及长宽比例等找到感兴趣的区域
        rect = cv2.minAreaRect(cnt)
        box = cv2.boxPoints(rect)
        box = box.astype(int)
        box = box.tolist()
        dist_01 = np.linalg.norm(np.array([box[0][0], box[0][1]]) - np.array([box[1][0], box[1][1]]))
        dist_12 = np.linalg.norm(np.array([box[1][0], box[1][1]]) - np.array([box[2][0], box[2][1]]))
        if dist_01 > dist_12:
            long_distance = dist_01
            short_distance = dist_12
        else:
            long_distance = dist_12
            short_distance = dist_01
        num_ele =  len(cnt)
        divisor = long_distance / short_distance
        area = long_distance * short_distance
        if  num_ele > 50 and short_distance < 10 :
            # and divisor > 10 and area < 60 and num_ele > 70
                remain_cnts.append(cnt)
    all_ele = cnts[0].reshape(-1, 2)
    for cnt in cnts:
        cnt = cnt.reshape(-1, 2)
        all_ele = np.concatenate((all_ele, cnt), axis=0)
    row = all_ele[:, 0]
    line = all_ele[:, 1]
    min_lin = np.array([min(line),  row[list(line).index(min(line))]])
    max_lin = np.array([max(line), row[list(line).index(max(line))]])
    print("min_row", min_lin, max_lin)
    remain_img = np.zeros_like(img)
    cv2.drawContours(remain_img, remain_cnts, -1, 255, 3)
    cv2.namedWindow("remain_cnts", 0)
    cv2.imshow("remain_cnts", remain_img)
    return remain_img, min_lin
旋转以及对齐
- 旋转
图像的平移,旋转参考博文
图像的旋转矩阵一般为:
M = [ c o s ( θ ) − s i n ( θ ) s i n ( θ ) c o s ( θ ) ] M= \begin{bmatrix} cos(θ) & -sin(θ) \\ sin(θ) &cos(θ) \end{bmatrix} M=[cos(θ)sin(θ)−sin(θ)cos(θ)]
但是单纯的这个矩阵是在原点处进行变换的,为了能够在任意位置进行旋转变换,opencv采用了另一种方式:
M = [ α − β ( 1 − α ) c e n t e r x − β c e n t e r y − β α β c e n t e r y + ( 1 − α ) c e n t e r y ] M= \begin{bmatrix} α & −β & (1−α)centerx−βcentery \\ −β &α & βcentery+(1−α)centery \end{bmatrix} M=[α−β−βα(1−α)centerx−βcenteryβcentery+(1−α)centery]
为了构造这个矩阵,opencv提供了一个函数:
cv2.getRotationMatrix2D(),这个函数需要三个参数,旋转中心,旋转角度,旋转后图像的缩放比例,得到旋转矩阵。(从旋转角θ转换到旋转矩阵)
仿射变换cv2.warpAffine()参数有src, M, dsize,分别表示源图像,变换矩阵,变换后的图像的长宽比如下例:
import cv2
import matplotlib.pyplot as plt

img = cv2.imread('flower.jpg')
rows,cols = img.shape[:2]
#第一个参数旋转中心,第二个参数旋转角度,第三个参数:缩放比例
M = cv2.getRotationMatrix2D((cols/2,rows/2),45,1)
#第三个参数:变换后的图像大小
res = cv2.warpAffine(img,M,(rows,cols))

plt.subplot(121)
plt.imshow(img)
plt.subplot(122)
plt.imshow(res)
仪 表 盘 中 的 旋 转 示 例 \color{blue}仪表盘中的旋转示例 仪表盘中的旋转示例
def get_top_bottom_by_minbox(contour, cnt):
    """
    输入指针区域二值图和轮廓坐标,返回尖端和末端的中心点坐标
    :param contour: 指针区域二值图
    :param cnts: 指针轮廓的坐标值
    :return: 返回轮廓尖端和末端的中心点
    """
    ## 从左下角顺时针返回最小外接矩形的四个角点
    rect = cv2.minAreaRect(cnt)
    box = cv2.boxPoints(rect)
    box = box.astype(int)
    box_ = contour.copy()
    cv2.drawContours(box_, [box], 0, 255, 2)
    cv2.namedWindow("box", 0)
    cv2.imshow("box", box_)
    cv2.imwrite('d:/box.jpg', box_)
    box = box.tolist()
    ## 求组成短边的点,短边与指针两端相接
    dist_01 = np.linalg.norm(np.array([box[0][0], box[0][1]]) - np.array([box[1][0], box[1][1]]))
    dist_12 = np.linalg.norm(np.array([box[1][0], box[1][1]]) - np.array([box[2][0], box[2][1]]))
    distance_pad = int(max(dist_01, dist_12) * 0.4)
    print("distance", dist_01, dist_12)
    if dist_01 < dist_12:
        short_1 = [box[0], box[1]]
        short_2 = [box[2], box[3]]
        long_1 = [box[0], box[3]]
        long_2 = [box[1], box[2]]
    else:
        short_1 = [box[0], box[3]]
        short_2 = [box[1], box[2]]
        long_1 = [box[0], box[1]]
        long_2 = [box[2], box[3]]
    ## 沿着长边中位线把区域分成两半,比较两边面积区分尖端和末端
    print("box", box)
    h, w = contour.shape
    cent_1 = [int(0.5*(long_1[0][0]+long_1[1][0])), int(0.5*(long_1[0][1]+long_1[1][1]))]
    cent_2 = [int(0.5*(long_2[0][0]+long_2[1][0])), int(0.5*(long_2[0][1]+long_2[1][1]))]
    print("cent", cent_1 , cent_2)
    # 将图片进行旋转后再剪裁
    center = np.array([int((cent_1[0] + cent_2[0]) / 2), int((cent_1[1] + cent_2[1]) / 2)])
    print("center", center)
    if cent_1[0] != cent_2[0]:
        angle = math.atan((cent_1[1] - cent_2[1]) / (cent_1[0] - cent_2[0])) * 180 / np.pi
        print(angle)
        rot_mat = cv2.getRotationMatrix2D((center[0], center[1]), angle, 1) # angle  Positive number means counterclockwise
        img_rotated = cv2.warpAffine(box_, rot_mat, (box_.shape[1], box_.shape[0]))
        cv2.imshow("img_rotate", img_rotated)
        area_1 = np.sum(img_rotated[center[1] - distance_pad:center[1], :])
        area_2 = np.sum(img_rotated[center[1]:center[1] + distance_pad, :])  # black 0
    else:
        area_2 = np.sum(box_[:, center[0] - distance_pad:center[0]])
        area_1 = np.sum(box_[:, center[0]:center[0]+distance_pad])  # black 0
    print("area_1", area_1)
    print("area_2", area_2)
    ## 输入指针二值图,末端外接角点,尖端外接角点,返回尖端和末端的中点
    if area_2 > area_1:
        top_point, bottom_point = get_top_bottom_by_area(contour, short_1, short_2) # short_1 is bottom
    else:
        top_point, bottom_point = get_top_bottom_by_area(contour, short_2, short_1)
    return top_point, bottom_point
- 对齐
仿射、投影、平移、缩放参考(https://blog.csdn.net/a352611/article/details/51418178, https://segmentfault.com/a/1190000015645951)
在仿射变换中,原始图像中的所有平行线仍将在输出图像中平行。 为了找到变换矩阵,我们需要输入图像中的三个点及其在输出图像中的相应位置。 然后cv.getAffineTransform将创建一个2x3矩阵,该矩阵将传递给cv.warpAffine。
示 例 代 码 如 下 : \color{blue}示例代码如下: 示例代码如下:
import cv2
import numpy as np
import matplotlib.pylab  as plt

img = cv2.imread('img5.jpg')
rows,cols,ch = img.shape

pts1 = np.float32([[50,50],[200,50],[50,200]])
pts2 = np.float32([[10,100],[200,50],[100,250]])

M = cv2.getAffineTransform(pts1,pts2)

dst = cv2.warpAffine(img,M,(cols,rows))

plt.subplot(121),plt.imshow(img),plt.title('Input')
plt.subplot(122),plt.imshow(dst),plt.title('Output')
plt.show()

