scikit learn 安装及注意事项
终于折腾完了,一下午就折腾这个scikit learn。其实,上次就已经知道这个工具了,但苦于上次没能安排。下午,老师出去上课,我就开始这个安装。希望你可以很快的安装。
前几天,安装python第三方库时出现各种不兼容问题。在qq群里有人跟我说用easy_install。从那开始,在python安装我都用这个了。一来比较方便。二来肯定是对的,不会出错。
好了,进入正题。
安装前的准备:
如果你安装了easy_install就很方便了。没有也没关系,去下个setuptools。安装好就可以了。其他的还需要安装的是numpy,scipy,matplotlib等。
你可以按照顺序去安装,你在easy_install.exe的目录下,一般在python安装目录下的scripts下。输入easy_install numpy,剩下的你就看着就可以了。其他的也类似。还有就是matplotlib不是那么容易安装的,你需要下载其他两个才可以安装成功。这两个是:python-dateutil-1.5.win32-py2.7.exe和pyparsing-2.0.1.win32-py2.7.exe。这个安装就一直点下去就可以了。
可以开始安装了,继续用easy_install scikit-learn。剩下就等待安装完了。
测试:
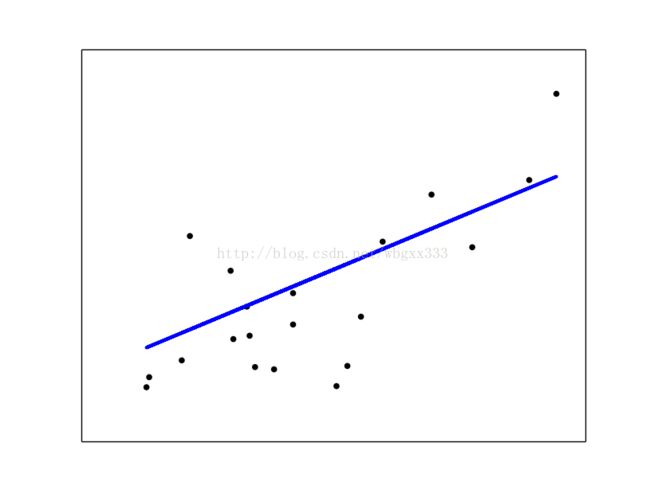
你可以去下个user guide 。里面有一些简单的可以测试的。还有就是其实user guide 里的例子程序可以在github里可以下到。我测试了一个plot_ols.py,结果是:
=========================================================
Linear Regression Example
=========================================================
This example uses the only the first feature of the `diabetes` dataset, in
order to illustrate a two-dimensional plot of this regression technique. The
straight line can be seen in the plot, showing how linear regression attempts
to draw a straight line that will best minimize the residual sum of squares
between the observed responses in the dataset, and the responses predicted by
the linear approximation.
The coefficients, the residual sum of squares and the variance score are also
calculated.
('Coefficients: \n', array([ 938.23786125]))
Residual sum of squares: 2548.07
Variance score: 0.47
备注:user guide 可以在google里找到。
附上一个介绍的网址:http://cbio.ensmp.fr/~nvaroquaux/scikit-learn/user_guide.html。
剩下的将开始我的python机器学习的旅程。安好……
