几种Kriging插值方法的比较
2015年12月08日星期二
T.s.road总结笔记:KrigingLab2204
作者说明:克里金插值程序
When running thisprogramme, the author’s PC setting is:
Microsoft Windows 7 (SP1) + Matlab R2011b +CPU 3.6GHz + RAM 8.0GB.
(Data form Lab 2204; Check by Keung Charteris & T.s.road CZQ)
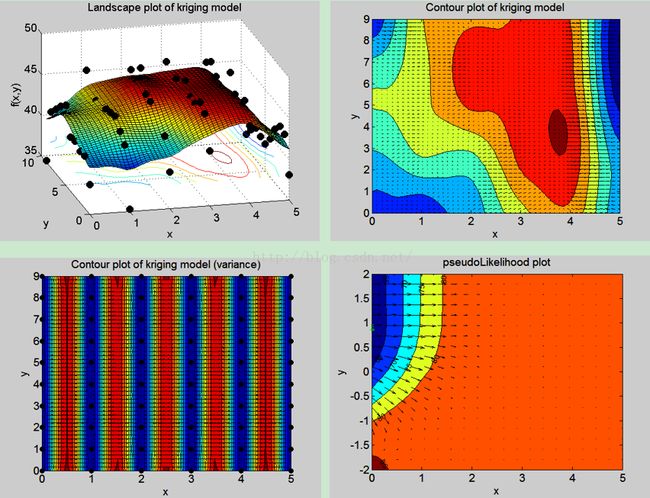
1.OriginKrigingTest.m
模型参数:
Building model...done
Evaluating model at (2.54.5).
Prediction mean = 45.520671.Prediction variance = 5.092937.
Derivatives of: predictionmean = (0.842217 0.907005). prediction variance = (-1.41371e-015-1.66364e-016).
Leave-one-outcrossvalidation: 4.863764 (using the mean squared error function).
Integrated Mean Square Error:129.112898.
Marginal likelihood (-log):-17.055291.
Pseudo likelihood (-log):59.781924.
Process variance: 11.699252
Sigma(1,1): 0.000000 (firstelement of intrinsic covariance matrix).
Formatted regressionfunction: 0
Calculating derivatives forcontour plot... (may take a while).
模型效果:
Figure1. OriginKriging2204
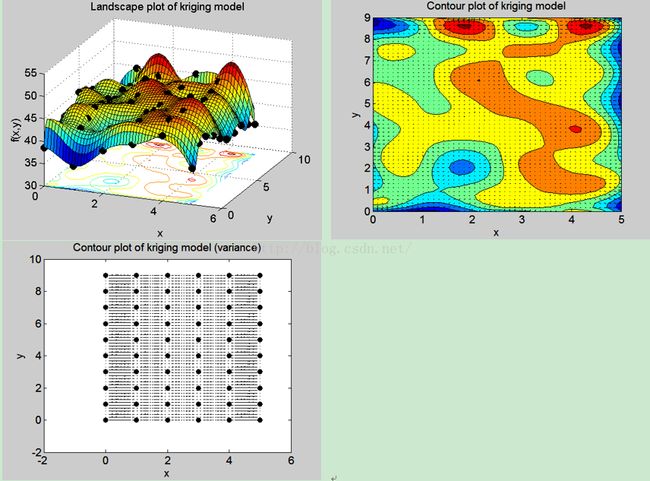
2.BlindKrigingTest.m
模型参数:
Building model...done
Evaluating model at (2.54.5).
Prediction mean = 46.655437.Prediction variance = 4.758408.
Derivatives of: predictionmean = (1.91241 1.77632). prediction variance = (0.0952736 0.0566486).
Leave-one-outcrossvalidation: 3.210582 (using the mean squared error function).
Integrated Mean Square Error:142.703266.
Marginal likelihood (-log):-32.439011.
Pseudo likelihood (-log):48.082329.
Process variance: 3.983416
Sigma(1,1): 0.000000 (firstelement of intrinsic covariance matrix).
Formatted regressionfunction: 1++x2^2+x1^2x2+x1x2^2
Calculating derivatives forcontour plot... (may take a while).
模型效果:
Figure 2. BlindKriging2204
3.RegressionKrigingTest.m
模型参数:
Building model...
### sqplab_armijo: stop ondxmin
alpha = 8.97409e-008
|d|_inf = 9.80257e-002
|xp-x|_inf = 8.79692e-009
Iteration 20 of 400
Iteration 40 of 400
Iteration 60 of 400
Iteration 80 of 400
Iteration 100 of 400
Iteration 120 of 400
Iteration 140 of 400
Iteration 160 of 400
Iteration 180 of 400
Iteration 200 of 400
Iteration 220 of 400
Iteration 240 of 400
Iteration 260 of 400
Iteration 280 of 400
Iteration 300 of 400
Iteration 320 of 400
Iteration 340 of 400
Iteration 360 of 400
Iteration 380 of 400
Iteration 400 of 400
gridminimum = 61.292342397225681
ans = 0 0.947368421052631
optimHp = 0 0.866051449108001 -0.155706427886195
perf = 61.281551099583041
done
Evaluating model at (2.54.5).
Prediction mean = 44.947054.Prediction variance = 1.995047.
Derivatives of: predictionmean = (0.742334 0.417816). prediction variance = (9.83295e-017 1.53015e-017).
Leave-one-outcrossvalidation: 4.580646 (using the mean squared error function).
Integrated Mean Square Error:49.164545.
Marginal likelihood (-log):-15.751582.
Pseudo likelihood (-log):61.281551.
Process variance: 3.661791
Sigma(1,1): 1.000000 (firstelement of intrinsic covariance matrix).
Formatted regressionfunction: 0
Calculating derivatives forcontour plot... (may take a while).
模型效果:
Figure 3. RegressionKriging2204
4.StochasticKrigingTest.m
模型参数:
Building model...done
Evaluating model at (2.54.5).
Prediction mean = 45.970621.Prediction variance = 245289024.547684.
Derivatives of: predictionmean = (5.33748e-009 6.68667e-009). prediction variance = (-1.05747e-010-6.31616e-011).
Leave-one-outcrossvalidation: 4659.638223 (using the mean squared error function).
Integrated Mean Square Error:11038006104.645782.
Marginal likelihood (-log):443.625659.
Pseudo likelihood (-log):748.535931.
Process variance:245289024.547684
Sigma(1,1): 1.886477 (firstelement of intrinsic covariance matrix).
Formatted regressionfunction: 0
Calculating derivatives forcontour plot... (may take a while).
模型效果:
Figure 4. StochasticKriging2204


