模拟幅度调制系统抗噪声性能仿真分析
文章目录
- 1. 引言
- 2. 系统模型
- 2-1 常规调幅调制(AM)
- 2-2 抑制载波双边带调制(DSB-SC)
- 2-3 单边带调制(SSB)
- 3. 抗干扰性能理论分析
- 3-1 AM相干解调抗噪声性能
- 3-2 DSB-SC相干解调抗噪声性能
- 3-3 SSB相干解调抗噪声性能
- 4. 仿真实现与仿真结果
- 5. 小结
1. 引言
我们知道,在模拟通信系统中,对基带信号m(t)的幅度调制主要有常规调幅调制(AM)、抑制载波双边带调制(DSB-SC)和单边带调制(SSB)三种。
在接下来的文章中,将给出模型及公式,从理论上介绍三种调制技术和他们对应的解调方法、分析三种幅度调制方法的抗干扰性能。
我们还将通过Matlab编写代码,对三种调制过程进行仿真,将仿真结果与理论对比,总结得出结论。
2. 系统模型
2-1 常规调幅调制(AM)
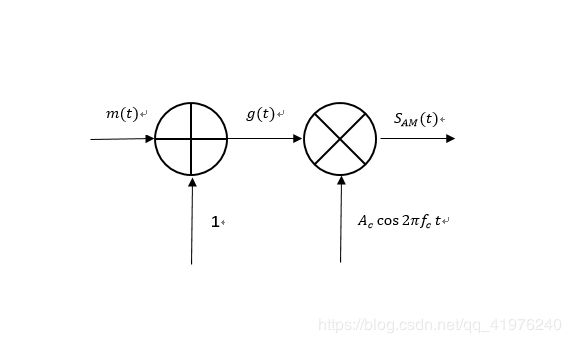
记基带信号为 m ( t ) m(t) m(t),记载波信号 c ( t ) = A c c o s 2 π f c t c(t)=A_ccos2πf_ct c(t)=Accos2πfct,下面介绍AM调制及解调:
调制
AM调制的时域表达式: S A M ( t ) = A c [ 1 + m ( t ) ] c o s 2 π f c t − − − − ① S_{AM}(t)=A_c[1+m(t)]cos2πf_ct----① SAM(t)=Ac[1+m(t)]cos2πfct−−−−① AM调制的频域表达式: S A M ( f ) = A c 2 [ δ ( f − f c ) + δ ( f + f c ) + M ( f − f c ) + M ( f − f c ) ] − − − − ② S_{AM}(f)=\frac{A_c}2[δ(f-f_c)+δ(f+f_c)+M(f-f_c)+M(f-f_c)]----② SAM(f)=2Ac[δ(f−fc)+δ(f+fc)+M(f−fc)+M(f−fc)]−−−−②
解调
2-2 抑制载波双边带调制(DSB-SC)
记基带信号为 m ( t ) m(t) m(t),记载波信号 c ( t ) = A c c o s 2 π f c t c(t)=A_ccos2πf_ct c(t)=Accos2πfct,下面介绍DSB-SC调制及解调:
调制
DSB-SC调制的时域表达式: S D S B ( t ) = A c m ( t ) c o s 2 π f c t − − − − ③ S_{DSB}(t)=A_cm(t)cos2πf_ct----③ SDSB(t)=Acm(t)cos2πfct−−−−③ DSB-SC调制的频域表达式: S D S B ( f ) = A c 2 [ M ( f − f c ) + M ( f − f c ) ] − − − − ④ S_{DSB}(f)=\frac{A_c}2[M(f-f_c)+M(f-f_c)]----④ SDSB(f)=2Ac[M(f−fc)+M(f−fc)]−−−−④

解调
2-3 单边带调制(SSB)
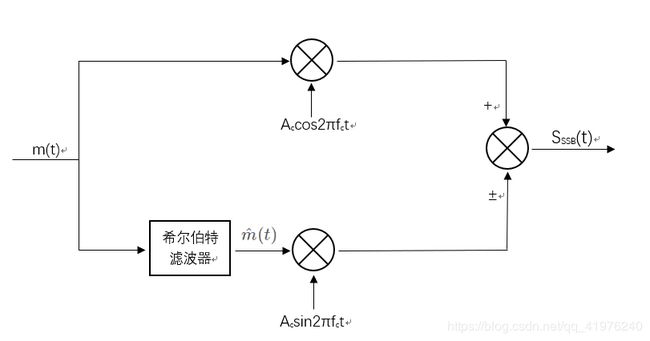
记基带信号为 m ( t ) m(t) m(t),记其希尔伯特变换为 m ^ ( t ) \hat{m}(t) m^(t),记载波信号 c ( t ) = A c c o s 2 π f c t c(t)=A_ccos2πf_ct c(t)=Accos2πfct,下面介绍SSB调制及解调:
调制
SSB调制的时域表达式: S S S B ( t ) = A c 2 [ m ( t ) c o s 2 π f c t ± m ^ ( t ) s i n 2 π f c t ] − − − − ⑤ S_{SSB}(t)=\frac{A_c}2[m(t)cos2πf_ct±\hat{m}(t)sin2πf_ct]----⑤ SSSB(t)=2Ac[m(t)cos2πfct±m^(t)sin2πfct]−−−−⑤SSB调制的频域表达式: S S S B ( f ) = A c 4 [ M ( f − f c ) + M ( f + f c ) ] ± A c 4 [ M ( f + f c ) s g n ( f + f c ) − M ( f − f c ) s g n ( f − f c ) ] − − − − ⑥ S_{SSB}(f)=\frac{A_c}4[M(f-f_c)+M(f+f_c)]±\frac{A_c}4[M(f+f_c)sgn(f+f_c)-M(f-f_c)sgn(f-f_c)]----⑥ SSSB(f)=4Ac[M(f−fc)+M(f+fc)]±4Ac[M(f+fc)sgn(f+fc)−M(f−fc)sgn(f−fc)]−−−−⑥
解调
3. 抗干扰性能理论分析
3-1 AM相干解调抗噪声性能
相关函数表达式
结合此前写下的AM调制和解调的知识,我们可以写出上图中对应函数的数学表达式:
▪ s ( t ) = A c [ m ( t ) + 1 ] c o s 2 π f c t ▪s(t)=A_c[m(t)+1]cos2πf_ct ▪s(t)=Ac[m(t)+1]cos2πfct ▪ s d ( t ) = 1 2 A c [ m ( t ) + 1 ] ( 1 + c o s 4 π f c t ) ▪s_d(t)=\frac12A_c[m(t)+1](1+cos4πf_ct) ▪sd(t)=21Ac[m(t)+1](1+cos4πfct) ▪ s o ( t ) = 1 2 A c m ( t ) ▪s_o(t)=\frac12A_cm(t) ▪so(t)=21Acm(t) ▪ n o ( t ) = 1 2 n c ( t ) ▪n_o(t)=\frac12n_c(t) ▪no(t)=21nc(t)
系统的抗噪声性能分析
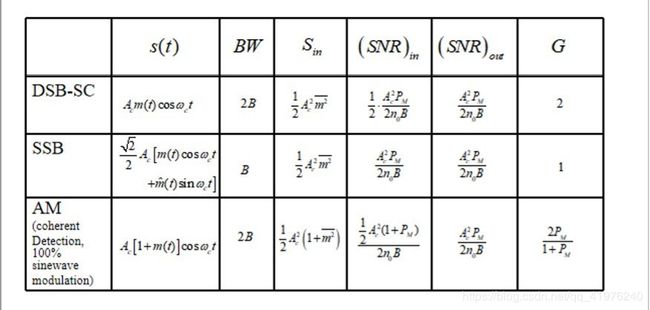
设基带信号 m ( t ) m(t) m(t)的带宽为B,则可推算得如下结果:
输入SNR
▪ S i n = < s 2 ( t ) > = A c 2 2 [ 1 + P m ] ▪S_{in}=
输出SNR
▪ S o u t = < s o 2 ( t ) > = A c 2 P m 4 ▪S_{out}=
输 入 S N R 输 出 S N R \frac{输入SNR}{输出SNR} 输出SNR输入SNR
G A M = 2 P m 1 + P m G_{AM}=\frac{2P_m}{1+P_m} GAM=1+Pm2Pm
3-2 DSB-SC相干解调抗噪声性能
相关函数表达式
结合此前写下的DSB_SC调制和解调的知识,我们可以写出上图中对应函数的数学表达式:
▪ s ( t ) = A c m ( t ) c o s 2 π f c t ▪s(t)=A_cm(t)cos2πf_ct ▪s(t)=Acm(t)cos2πfct ▪ s d ( t ) = A c 2 m ( t ) ( 1 + c o s 4 π f c t ) ▪s_d(t)=\frac{A_c}2m(t)(1+cos4πf_ct) ▪sd(t)=2Acm(t)(1+cos4πfct) ▪ s o ( t ) = A c 2 m ( t ) ▪s_o(t)=\frac{A_c}2m(t) ▪so(t)=2Acm(t) ▪ n o ( t ) = 1 2 n c ( t ) ▪n_o(t)=\frac12n_c(t) ▪no(t)=21nc(t)
系统的抗噪声性能分析
设基带信号 m ( t ) m(t) m(t)的带宽为B,则可推算得如下结果:
输入SNR
▪ S i n = < s 2 ( t ) > = A c 2 2 < m 2 ( t ) > = A c 2 P m 2 ▪S_{in}=
输出SNR
▪ S o u t = A C 2 P m 4 = 1 2 S i n ▪S_{out}=\frac{A_C^2P_m}4=\frac12S_{in} ▪Sout=4AC2Pm=21Sin ▪ N o u t = E [ n 0 2 ( t ) ] = 1 4 N i n ▪N_{out}=E[n_0^2(t)]=\frac14N_{in} ▪Nout=E[n02(t)]=41Nin ▪ ( S N ) o u t = S o u t N o u t = A C 2 P m 2 n 0 B ▪(\frac{S}N)_{out}=\frac{S_{out}}{N_{out}}=\frac{A_C^2P_m}{2n_0B} ▪(NS)out=NoutSout=2n0BAC2Pm
输 入 S N R 输 出 S N R \frac{输入SNR}{输出SNR} 输出SNR输入SNR
G D S B − S C = 2 G_{DSB-SC}=2 GDSB−SC=2
3-3 SSB相干解调抗噪声性能
相关函数表达式
结合此前写下的SSB调制和解调的知识,我们可以写出上图中对应函数的数学表达式:
▪ s ( t ) = A c 2 [ m ( t ) c o s 2 π f c t ± m ^ ( t ) s i n 2 π f c t ] ▪s(t)=\frac{A_c}2[m(t)cos2πf_ct±\hat{m}(t)sin2πf_ct] ▪s(t)=2Ac[m(t)cos2πfct±m^(t)sin2πfct] ▪ s d ( t ) = A c 4 [ m ( t ) + m ( t ) c o s 4 π f c t ± m ^ ( t ) s i n 4 π f c t ] ▪s_d(t)=\frac{A_c}4[m(t)+m(t)cos4πf_ct±\hat{m}(t)sin4πf_ct] ▪sd(t)=4Ac[m(t)+m(t)cos4πfct±m^(t)sin4πfct] ▪ s o ( t ) = A c 4 m ( t ) ▪s_o(t)=\frac{A_c}4m(t) ▪so(t)=4Acm(t) ▪ n o ( t ) = 1 2 n c ( t ) ▪n_o(t)=\frac12n_c(t) ▪no(t)=21nc(t)
系统的抗噪声性能分析
设基带信号 m ( t ) m(t) m(t)的带宽为B,则可推算得如下结果:
输入SNR
▪ S i n = < s 2 ( t ) > = A c 2 P m 4 ▪S_{in}=
输出SNR
▪ S o u t = A C 2 P m 8 = 1 4 S i n ▪S_{out}=\frac{A_C^2P_m}8=\frac14S_{in} ▪Sout=8AC2Pm=41Sin ▪ N o u t = E [ n 0 2 ( t ) ] = 1 4 N i n ▪N_{out}=E[n_0^2(t)]=\frac14N_{in} ▪Nout=E[n02(t)]=41Nin ▪ ( S N ) o u t = S o u t N o u t = A C 2 P m 4 n 0 B ▪(\frac{S}N)_{out}=\frac{S_{out}}{N_{out}}=\frac{A_C^2P_m}{4n_0B} ▪(NS)out=NoutSout=4n0BAC2Pm
输 入 S N R 输 出 S N R \frac{输入SNR}{输出SNR} 输出SNR输入SNR
G S S B = 1 G_{SSB}=1 GSSB=1
4. 仿真实现与仿真结果
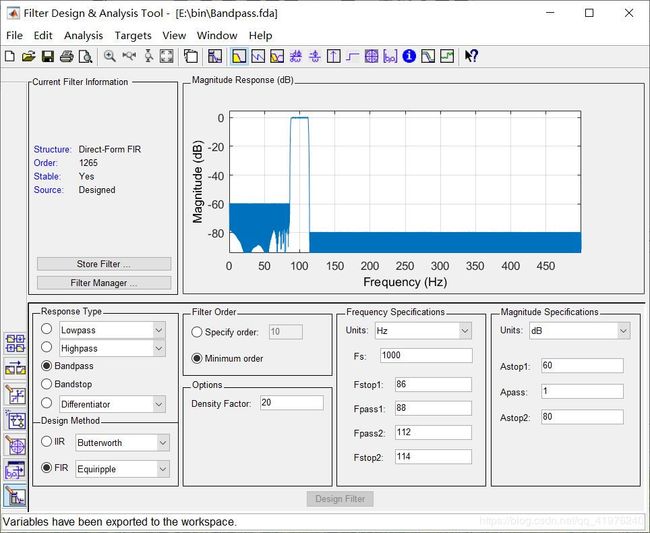
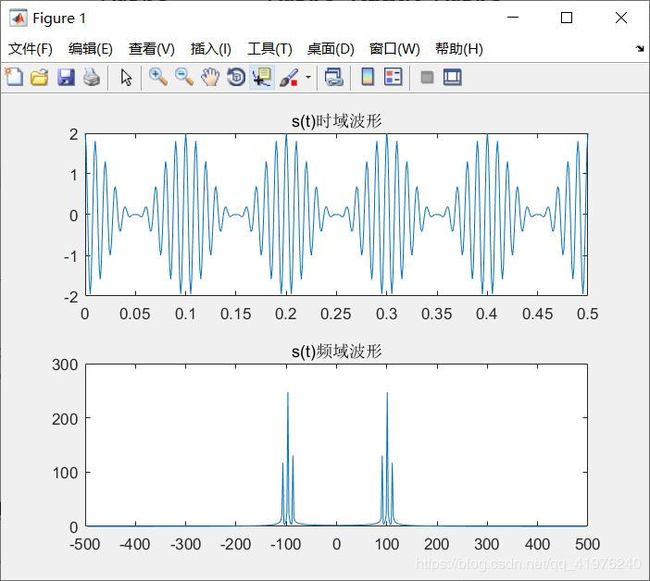
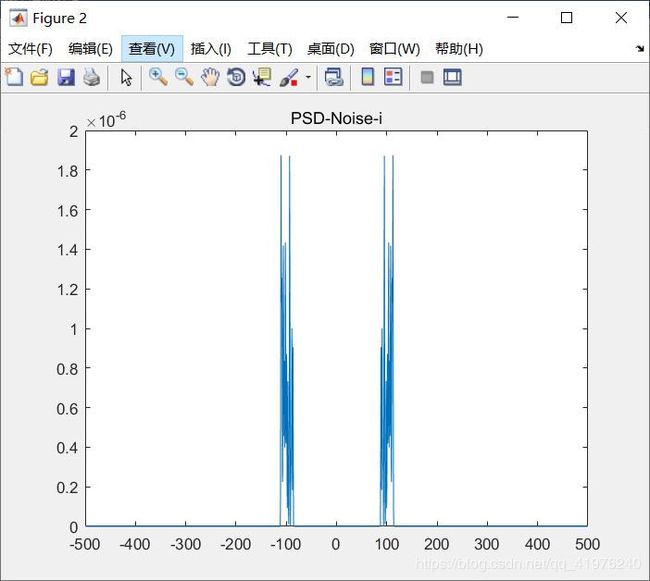
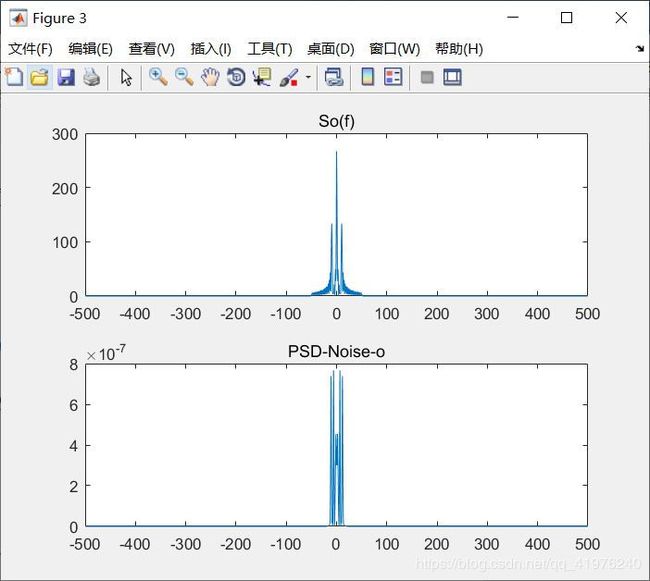
关键代码截图:
%--------AM调制----------
T_start=0;%开始时间
T_stop=0.5;%截止时间
T=T_stop-T_start;%仿真持续时间
T_sample=1/1000;%采样间隔
f_sample=1/T_sample; % 采样速率
N_sample=T/T_sample;% 采样点数

n=0:N_sample;
mt=cos(2*pi*10*n*T_sample);
ct=cos(2*pi*100*n*T_sample);
st=(1+mt).*ct;
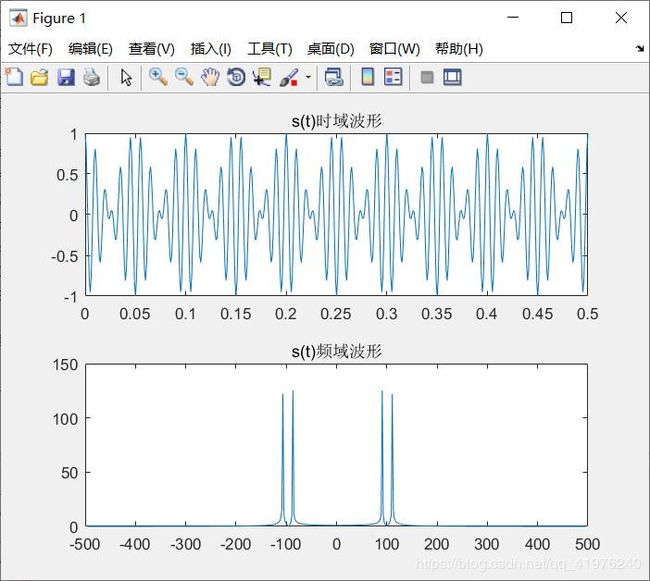
figure(1);
subplot(2,1,1);
plot(n*T_sample,st);
title('s(t)时域波形');
f_res=f_sample/length(st);%频率分辨率
f_max=f_res*length(st)/2;%最大频率
F=abs(fft(st));
F_rearrange=[F(length(st)/2+1:length(st)-1),F(1:length(st)/2)];
subplot(2,1,2);
plot((-length(st)/2+2:length(st)/2-2)*f_res,F_rearrange(1:length(st)-3));
title('s(t)频域波形');
PSD_st=abs(fft(st)).^2*T_sample/T/f_sample;
P_st=sum(PSD_st)/length(PSD_st)*f_sample;

%%noise的创建
noise_i=wgn(1,length(st),-33);
noise=conv(noise_i,Bandpass);
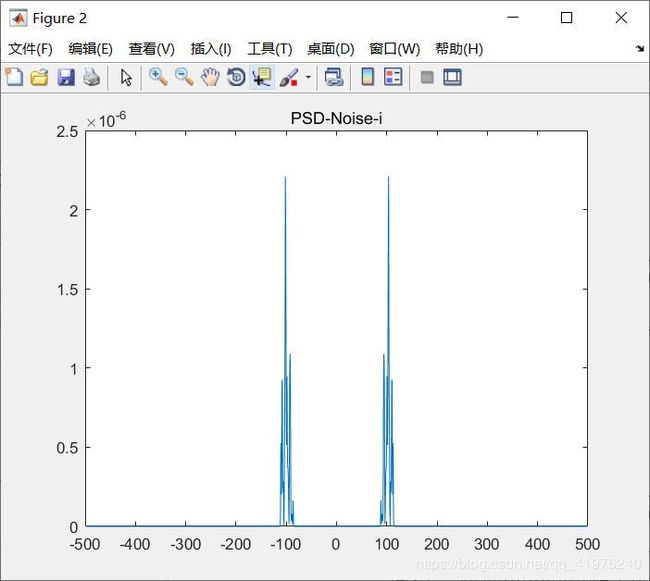
PSD_Noise_i=abs(fft(noise)).^2*T_sample/T/f_sample;
figure(2);
f_res=f_sample/length(noise);%频率分辨率
f_max=f_res*length(noise)/2;%最大频率
F1_rearrange=[PSD_Noise_i(length(noise)/2+1:length(noise)-1),PSD_Noise_i(1:length(noise)/2)];
plot((-length(noise)/2+2:length(noise)/2-2)*f_res,F1_rearrange(1:length(noise)-3));
title('PSD-Noise-i');
P_noise_i=sum(PSD_Noise_i)/length(PSD_Noise_i)*f_sample;
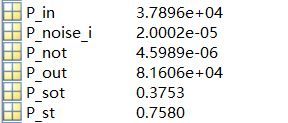
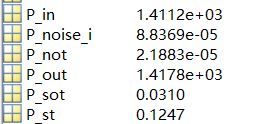
P_in=P_st/P_noise_i;

%%解调
sdt=st.*ct;
c1t=conv(ct,Bandpass);
ndt=noise.*c1t;
sot=conv(sdt,Lowpass);
not=conv(ndt,Lowpass);
figure(3);
f_res=f_sample/length(sot);%频率分辨率
F=abs(fft(sot));
F_rearrange=[F(length(sot)/2+1:length(sot)-1),F(1:length(sot)/2)];
subplot(2,1,1);
plot((-length(sot)/2+1:length(sot)/2-1)*f_res,F_rearrange(1:length(sot)-1));
title('So(f)');
PSD_sot=abs(fft(sot)).^2*T_sample/T/f_sample;
P_sot=sum(PSD_sot)/length(PSD_sot)*f_sample;
f_res=f_sample/length(not);%频率分辨率
PSD_Noise_o=abs(fft(not)).^2*T_sample/T/f_sample;
F1_rearrange=[PSD_Noise_o(length(not)/2+1:length(not)-1),PSD_Noise_o(1:length(not)/2)];
subplot(2,1,2);
plot((-length(not)/2+2:length(not)/2-2)*f_res,F1_rearrange(1:length(not)-3));
title('PSD-Noise-o');
P_not=sum(PSD_Noise_o)/length(PSD_Noise_o)*f_sample;
P_out=P_sot/P_not;

%%输出输入功率比值
G=P_out/P_in;
disp('G_(AM)=');
disp(G);
%--------DSB-SC调制----------
T_start=0;%开始时间
T_stop=0.5;%截止时间
T=T_stop-T_start;%仿真持续时间
T_sample=1/1000;%采样间隔
f_sample=1/T_sample; % 采样速率
N_sample=T/T_sample;% 采样点数

n=0:N_sample;
mt=cos(2*pi*10*n*T_sample);
ct=cos(2*pi*100*n*T_sample);
st=(1+mt).*ct;
figure(1);
subplot(2,1,1);
plot(n*T_sample,st);
title('s(t)时域波形');
f_res=f_sample/length(st);%频率分辨率
f_max=f_res*length(st)/2;%最大频率
F=abs(fft(st));
F_rearrange=[F(length(st)/2+1:length(st)-1),F(1:length(st)/2)];
subplot(2,1,2);
plot((-length(st)/2+2:length(st)/2-2)*f_res,F_rearrange(1:length(st)-3));
title('s(t)频域波形');
PSD_st=abs(fft(st)).^2*T_sample/T/f_sample;
P_st=sum(PSD_st)/length(PSD_st)*f_sample;

%%noise的创建
noise_i=wgn(1,length(st),-33);
noise=conv(noise_i,Bandpass);
PSD_Noise_i=abs(fft(noise)).^2*T_sample/T/f_sample;
figure(2);
f_res=f_sample/length(noise);%频率分辨率
f_max=f_res*length(noise)/2;%最大频率
F1_rearrange=[PSD_Noise_i(length(noise)/2+1:length(noise)-1),PSD_Noise_i(1:length(noise)/2)];
plot((-length(noise)/2+2:length(noise)/2-2)*f_res,F1_rearrange(1:length(noise)-3));
title('PSD-Noise-i');
P_noise_i=sum(PSD_Noise_i)/length(PSD_Noise_i)*f_sample;
P_in=P_st/P_noise_i;

%%解调
sdt=st.*ct;
c1t=conv(ct,Bandpass);
ndt=noise.*c1t;
sot=conv(sdt,Lowpass);
not=conv(ndt,Lowpass);
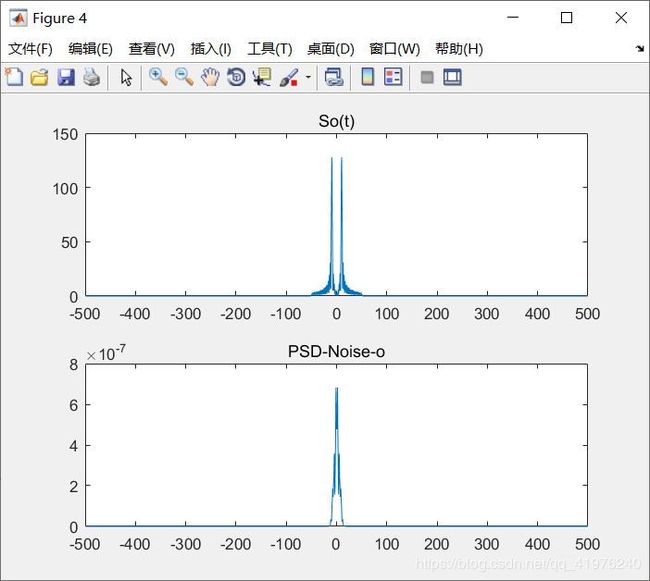
figure(4);
f_res=f_sample/length(sot);%频率分辨率
F=abs(fft(sot));
F_rearrange=[F(length(sot)/2+1:length(sot)-1),F(1:length(sot)/2)];
subplot(2,1,1);
plot((-length(sot)/2+1:length(sot)/2-1)*f_res,F_rearrange(1:length(sot)-1));
title('So(t)');
PSD_sot=abs(fft(sot)).^2*T_sample/T/f_sample;
P_sot=sum(PSD_sot)/length(PSD_sot)*f_sample;
f_res=f_sample/length(not);%频率分辨率
PSD_Noise_o=abs(fft(not)).^2*T_sample/T/f_sample;
F1_rearrange=[PSD_Noise_o(length(not)/2+1:length(not)-1),PSD_Noise_o(1:length(not)/2)];
subplot(2,1,2);
plot((-length(not)/2+2:length(not)/2-2)*f_res,F1_rearrange(1:length(not)-3));
title('PSD-Noise-o');
P_not=sum(PSD_Noise_o)/length(PSD_Noise_o)*f_sample;
P_out=P_sot/P_not;

%%输出输入功率比值
G=P_out/P_in;
disp('G_(DSB-SC)=');
disp(G);
%--------SSB调制----------
T_start=0;%开始时间
T_stop=0.5;%截止时间
T=T_stop-T_start;%仿真持续时间
T_sample=1/1000;%采样间隔
f_sample=1/T_sample; % 采样速率
N_sample=T/T_sample;% 采样点数

n=0:N_sample;
mt=cos(2*pi*10*n*T_sample);
ct=cos(2*pi*100*n*T_sample);
s1t=mt.*ct;
st=conv(s1t,Lowpass1);
figure(1);
subplot(2,1,1);
n1=0:length(st)-1;
plot(n1*T_sample,st);
title('s(t)时域波形');
f_res=f_sample/length(st);%频率分辨率
f_max=f_res*length(st)/2;%最大频率
F=abs(fft(st));
F_rearrange=[F(length(st)/2+1:length(st)-1),F(1:length(st)/2)];
subplot(2,1,2);
plot((-length(st)/2+2:length(st)/2-2)*f_res,F_rearrange(1:length(st)-3));
title('s(t)频域波形');
PSD_st=abs(fft(st)).^2*T_sample/T/f_sample;
P_st=sum(PSD_st)/length(PSD_st)*f_sample;

%%noise的创建
noise_i=wgn(1,length(st),-33);
noise=conv(noise_i,Bandpass);
PSD_Noise_i=abs(fft(noise)).^2*T_sample/T/f_sample;
figure(2);
f_res=f_sample/length(noise);%频率分辨率
f_max=f_res*length(noise)/2;%最大频率
F1_rearrange=[PSD_Noise_i(length(noise)/2+1:length(noise)-1),PSD_Noise_i(1:length(noise)/2)];
plot((-length(noise)/2+2:length(noise)/2-2)*f_res,F1_rearrange(1:length(noise)-3));
title('PSD-Noise-i');
P_noise_i=sum(PSD_Noise_i)/length(PSD_Noise_i)*f_sample;
P_in=P_st/P_noise_i;


%%解调
c1t=cos(2*pi*100*n1*T_sample);
sdt=st.*c1t;
c2t=conv(c1t,Bandpass);
ndt=noise.*c2t;
sot=conv(sdt,Lowpass);
not=conv(ndt,Lowpass);
figure(3);
f_res=f_sample/length(sot);%频率分辨率
F=abs(fft(sot));
F_rearrange=[F(length(sot)/2+1:length(sot)-1),F(1:length(sot)/2)];
subplot(2,1,1);
plot((-length(sot)/2+2:length(sot)/2-2)*f_res,F_rearrange(1:length(sot)-3));
title('So(t)');
PSD_sot=abs(fft(sot)).^2*T_sample/T/f_sample;
P_sot=sum(PSD_sot)/length(PSD_sot)*f_sample;
f_res=f_sample/length(not);%频率分辨率
PSD_Noise_o=abs(fft(not)).^2*T_sample/T/f_sample;
F1_rearrange=[PSD_Noise_o(length(not)/2+1:length(not)-1),PSD_Noise_o(1:length(not)/2)];
subplot(2,1,2);
plot((-length(not)/2+2:length(not)/2-2)*f_res,F1_rearrange(1:length(not)-3));
title('PSD-Noise-o');
P_not=sum(PSD_Noise_o)/length(PSD_Noise_o)*f_sample;
P_out=P_sot/P_not;

%%输出输入功率比值
G=P_out/P_in;
disp('G_(SSB)=');
disp(G);
5. 小结
通过本次实验,我重新复习了三种幅度调制技术及其相应的解调方法,同时我练习使用了Matlab仿真,对滤波器设计、功率谱密度计算有了更进一步的了解;
三种幅度调制方式中,DSB-SC调制抗噪声性能较好,而SSB调制对带宽资源占用较少,AM调制的解调增益G是Pm的函数。


