【特征工程】处理经纬度的9种方法/技巧(转载)
转载加修改:Feature engineering: all I learnt about Geo-spatial features
1. 极坐标法
Add two new features of Polar coordinates to the dataset
rot_x = x * cosθ + y * sinθ
rot_y = x * sinθ - y * cosθ
2. Add 4 new features of rotational Cartesian coordinates
def rotation(data):
  '''
  # most frequently used degrees are 30,45,60
  input: dataframe containing Latitude(x) and Longitude(y)
  '''
  rot_45_x = (0.707 * data['x']) + (0.707 * data['y'])
  rot_45_y = (0.707 * data['y']) + (0.707 * data['x'])
  rot_30_x = (0.866 * data['x']) + (0.5 * data['y'])
  rot_30_y = (0.866 * data['y']) + (0.5 * data['x'])
  return rot_45_x, rot_45_y, rot_30_x, rot_30_y
目的:给树模型更多的空间特征信息。可以从不同的视角可视化坐标。还可以通过主成分分析(PCA)进行转换。
3.Haversine distance:
Haversine distance计算的是给定经度和纬度的球面上任意两点之间的大圆距离。它是三角学的一个组成部分,主要用于导航技术。在我们的例子中,我们必须将点转换为弧度度量,并输入地球的平均半径来计算两个点之间的距离。
def haversine_dist(lat1,lng1,lat2,lng2):
  lat1, lng1, lat2, lng2 = map(np.radians, (lat1, lng1, lat2, lng2))
  radius = 6371  # Earth's radius taken from google
  lat = lat2 - lat1
  lng = lng2 - lng1
  d = np.sin(lat/2) ** 2 + np.cos(lat1) * np.cos(lat2) * np.sin(lng/2) ** 2
  h = 2 * radius * np.arcsin(np.sqrt(d))
  return h
目的:用于计算城市中心和我们的兴趣点之间的距离,或接送点之间的旅行距离(出租车票价数据集)等。这在我们的数据集中是一个非常好的特性。我们还可以提取中心距离作为一个单独的新特征。
4.Manhattan distance:
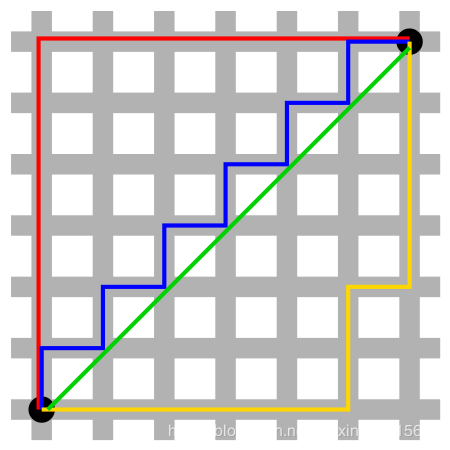
曼哈顿距离是由十九世纪的赫尔曼·闵可夫斯基所创词汇,是种使用在几何度量空间的几何学用语,用以标明两个点在标准坐标系上的绝对轴距总和。

图中红线代表曼哈顿距离,绿色代表欧氏距离,也就是直线距离,而蓝色和黄色代表等价的曼哈顿距离。曼哈顿距离——两点在南北方向上的距离加上在东西方向上的距离,即d(i,j)=|xi-xj|+|yi-yj|。对于一个具有正南正北、正东正西方向规则布局的城镇街道,从一点到达另一点的距离正是在南北方向上旅行的距离加上在东西方向上旅行的距离,因此,曼哈顿距离又称为出租车距离。
如在平面上,坐标(x1, y1)的i点与坐标(x2, y2)的j点的曼哈顿距离为:
d(i,j)=|X1-X2|+|Y1-Y2|
优点:计算速度快
代码:
def manhattan_dist(lat1, lng1, lat2, lng2):
    '''
    calculating two haversine distances by,
     - avoiding Latitude of one point
     - avoiding Longitude of one point
    and adding it together.
    '''
    a = haversine_dist(lat1, lng1, lat1, lng2)
    b = haversine_dist(lat1, lng1, lat2, lng1)
    return a + b
5.Bearing degree:
def bearing_degree(lat1, lng1, lat2, lng2):
    '''
    calculate angle between two points
    '''
    radius = 6371  # Mean radius of Earth
    diff_lng = np.radians(lng2 - lng1)
    lat1, lng1, lat2, lng2 = map(np.radians, (lat1, lng1, lat2, lng2))
    y = np.sin(diff_lng) * np.cos(lat2)
    x = np.cos(lat1) * np.sin(lat2) - np.sin(lat1) * np.cos(lat2) * np.cos(diff_lng)
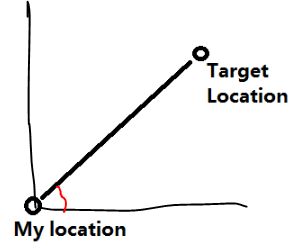
    return np.degrees(np.arctan2(y, x))
应用场合:当数据集包含出租车费/时间预测数据集中的一些移动主题时。
6.用PCA增加两个特征
from sklearn.decomposition import PCA
def pca(data):
  '''
  input: dataframe containing Latitude(x) and Longitude(y)
  '''
  coordinates = data[['x','y']].values
  pca_obj = PCA().fit(coordinates)
  pca_x = pca_obj.transform(data[['x', 'y']])[:,0]
  pca_y = pca_obj.transform(data[['x', 'y']])[:,1]
  return pca_x, pca_y
目的:使用sklearn包中的PCA,它可以根据坐标空间中点的密度自动学习最佳旋转角度,并可以将这些点转换到相同的空间中,从而获得更高的精度。
7.用反响编码(Reverse-Geocoder)增加新的特征
Reverse-Geocoder
它可以指定纬度和经度坐标的建筑名称、街道名称等一切信息。
import reverse_geocoder as rg
def geocoder(data):
  '''
  input: dataframe containing Latitude(x) and Longitude(y) coordinates
  output: JSON data containing info on available building or street names.
  '''
  coordinates = data[['x','y']].values
  results = rg.search(coordinates) # default mode = 2
  rerturn results
当我们知道官方/家庭区域或任何关于建筑、政府/私人建筑等的历史时,这是非常有用的。它为数据提供了一个新的视角。
8.在数据集中添加编码坐标的新特征
Geohash
是一个公共领域的地理编码系统,将坐标编码成一个短字符串或数字。
Geohash根据位数将地球分成不同大小的“buckets”(短Geohash代码创建大区域,长代码创建小区域)。
import Geohash as gh

def geohash(data, precision=1):
  '''
  input: dataframe containing Latitude(x) and Longitude(y)
  output: List of numbers corresponding to their allocated buckets.
  '''
  coords = data[['x','y']].values
  enc_coords = gh.encode(coords, precision)
  return enc_coords
it considers the whole world rather than specific part.
9.Add new feature and assign coordinates to different clusters
Clusters
我们通常在数据集中有大量的坐标。我们可以把它们分成许多簇。这给了我们额外的能力来计算其他任何方法都无法计算的不同事物。
举例(Taxi fare prediction)
- 聚合一个聚类中的拾取点和另一个聚类中的丢弃点,并计算这些相应聚类的中心之间的距离。
- 计算有多少辆出租车离开聚类,反之亦然。
- 计算分配的聚类中心和我们感兴趣的各个点之间的距离
- 检查每个聚类的趋势/密度,即在任何时间点聚类内有多少辆出租车。
- 计算出租车从聚类中驶出的平均距离,反之亦然。
- 分析工作日和周末的聚类密度,了解哪些是公务旅行等等。
Demo
from sklearn.cluster import KMeans

def cluster(data):
  '''
  input: dataframe containing Latitude(x) and Longitude(y) coordinates
  output: series of cluster labels that each row of coordinates belongs to.
  '''
  model = KMeans(n_clusters=50)
  labels = model.fit_predict(data)
  return labels
如果我们能够基于集群包含一组不同的特性,那么我们的模型将会受益。
可视化
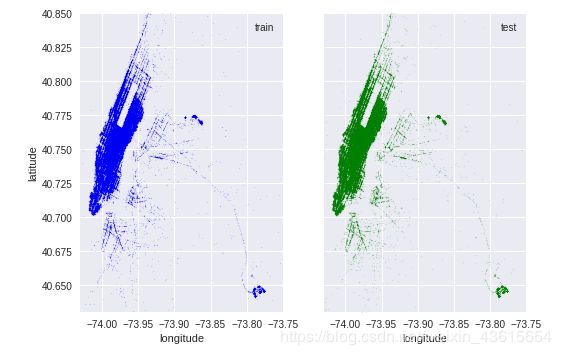
在散点图中绘制了坐标,并散布了一些微小的小点,从字面上显示了放大后的街道结构。(真好看,等着学习一下)

通过选择一个非常小的alpha值,我们可以使用笛卡尔坐标实现这种类型的可视化。
import matplotlib.pyplot as plt
def visualize(data)
  '''
  input: dataframe containing Latitude(x) and Longitude(y)
  '''
  data[['x','y']].scatter(color='blue', s=1, alpha=0.1)
  plt.title('Visualization of Latitude and Longitude')
  plt.ylabel('latitude')
  plt.xlabel('longitude')
  plt.show()
Folium
Folium是基于JAVA开发的一个地理可视化坐标的库,我们可以在真实地图中标记单个点或将点簇标记在一起,等等。
import folium
# create an initial map and add objects to it
m = folium.Map(location=[lat,lng]) # latitude and longitude of the city that we are interested

# create a point marker and add to the map created
folium.Marker([lat,lng], popup='Mt. Hood Meadows', tooltip="click me").add_to(m)

# create a initial cluster and add marker point to the cluster
marker_cluster = folium.MarkerCluster("Public building cluster").add_to(uk)
folium.Marker([lat,lng], popup='Eiffel tower', tooltip="click me").add_to(marker_cluster)
该软件包可创建交互式地图可视化效果,您可以在其中放大和缩小地图。 查看他们的网站了解更多。
引用:
python-visualization/folium
https://www.kaggle.com/gaborfodor/from-eda-to-the-top-lb-0-367/notebook#Feature-Extraction
sklearn → https://scikitlearn.org/stable/modules/generated/sklearn.cluster.k_means.html#sklearn.cluster.k_means
Geohash → https://github.com/vinsci/geohash/
Reverse-Geocoder → https://github.com/thampiman/reverse-geocoder
Books → Data Mining techniques from Wiley written by Gordon S. Linoff and Michael J.A.Berry
https://www.commonlounge.com/discussion/8bc2062e262440f28f29b53015243e31
https://datascience.stackexchange.com/questions/23651/can-gps-coordinates-latitude-and-longitude-be-used-as-features-in-a-linear-mod

