Andrew Ng Machine Learning——Work(Two)——Logistic regression——Regularized(Based on Python 3.7)
Python 3.7
所用数据集链接:正则化逻辑回归所用数据(ex2data2.txt),提取码:c3yy
目录
- Regularized Logistic regression
- 1.0 Package
- 1.1 Load data
- 1.2 Visualization data
- 1.3 Data preprocess
- 1.4 Feature mapping
- 1.5 Sigmoid function
- 1.6 Regularized costunction
- 1.7 Regularized gradientfunction
- 1.8 Train model
- 1.9 Visualization result
- 1.10 Evalute model
- 1.11 Apply model
- 1.12 All
Regularized Logistic regression
1.0 Package
一样,先进包:
import numpy as np
# 处理数据,尤其是矩阵或数组
import pandas as pd
# 读取数据,转换格式
import matplotlib.pyplot as plt
# 画图
import scipy.optimize as opt
# 高级优化函数
1.1 Load data
读取数据,代码如下:
def load_data(path):
# 定义函数,传入参数path
    data=pd.read_csv(path,header=None,names=['test1','test2','accept'])
# 读取命令,读取path指定文件,并关闭默认索引,将列索引命名为names中内容
    return data,data.head(),data.describe()
# 其中data.head()为头文件,也即简单描述data的文件,data.describe()返沪data的统计信息(均值,方差等等)
data,data_head,data_describe=load_data('ex2data2.txt')
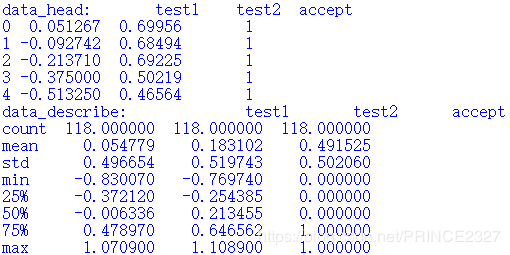
print(data_head)
print(data_describe)
# 查看
1.2 Visualization data
读取完数据之后,最想做的就是可视化了,代码如下:
def view_data():
# 定义函数,不传入参数
    pos_data=data[data.accept.isin(['1'])]
# data.accept.isin(['1'])指返回data中列索引为accept列中值为1的行数,
# 此命令即返回了data中所有y为1的行
    neg_data=data[data.accept.isin(['0'])]
# 同上
    fig,ax=plt.subplots(figsize=(6,6))
# 创建画布fig,尺寸为6*6,并创建其中对象ax
    ax.scatter(pos_data['test1'],pos_data['test2'],c='r',label='Accept')
# 指明对象为scatter(散点),并传入其横纵坐标,最终指明颜色
    ax.scatter(neg_data['test1'],neg_data['test2'],c='black',label='Reject')
# 同上,画出负样本
    ax.set_xlabel('Test1')
    ax.set_ylabel('Test2')
# 设置横纵轴名称
    ax.legend()
# 显示标签
    ax.set_title('Test and Accept')
# 设置图主题
    plt.show()
# 可视化
#view_data()
输出如下:

很明显,这不是线性可分的,所以我们要想办法对其进行特征映射(即添加高次方特征)
1.3 Data preprocess
在特征映射之前,首先对于数据进行预处理:
def preprocess_data(data):
# 定义函数,传入参数
    data.insert(0,'one',1)
# 在第一列加入一列1,并将索引设置为one
    x=(data.iloc[:,:-1]).values
    y=(data.iloc[:,-1]).values
# 读取数据,分为x,y
    return x,y
# 返回
x,y=preprocess_data(data)
#print(x.shape) (118,28) 二维数组
#print(y.shape)  (118,)  一维数组
# 查看x,y形状
1.4 Feature mapping
特征映射的目的是创造更多特征,以便更好拟合,这里将原本的两个特征映射到其六次方为止,代码如下:
def feature_mapping(a, b, power):
# 定义函数,传入参数
    data_ = {}
# 创建一个空字典
    for i in np.arange(power + 1):
        for p in np.arange(i + 1):
            data_["x{}{}".format(i - p, p)] = np.power(a, i - p) * np.power(b, p)
# 向字典中不断添加键值对,键为x(i-p)(p),值为等式右方公式计算结果
    return pd.DataFrame(data_)
# 返回,DataFrame函数将字典转换为数据表形式,这样是为了方便后续读取与转换等
x_1=(data['test1']).values  # 一维数组,因为只读取了某一列
# 取原数据集中第一维特征
# print(x_1)
x_2=(data['test2']).values
# 取原数据集中第二维特征
data_new=feature_mapping(x_1,x_2,6)
# 特征映射,并将其放在一个新的Dataframe中,名为data_new,不过注意
# 新的data_new中并没有y,只是x的高阶映射
#print(data_new.head())
x=(data_new).values #二维数组
# 转换为数组
y=(data['accept']).values
# 转换为数组,注意这里需要从原数据集中读取
theta=np.zeros(x.shape[1])
# 初始化theta
print(x.shape,y.shape,theta.shape)
#查看形状 (118, 28) (118,) (28,)
1.5 Sigmoid function
定义sigmoid函数,后续会用到:
def sigmoid(z):
    return 1/(1+np.exp(-z))
准备工作都做完了,下面该开始进入核心。
1.6 Regularized costunction
首先定义正则化的代价函数,放图:
![]()
注意正则化不对 θ 0 \theta_{0} θ0 作用,因为其是常数项,不必限制,代码如下:
def regularized_costfunction(theta,x,y,l):
# 定义函数,传入参数
    theta=np.zeros(x.shape[1])
# 初始化theta(此时的theta是多维了)
    reg=theta[1:]@theta[1:]
# 计算正则化项,从theta_{1}开始计算
    h=x@theta
    J=((-y)*np.log(sigmoid(h))-(1-y)*np.log(sigmoid(h)))
    cost=sum(J)/len(x)+reg*l/(2*len(x))
# 正则化代价函数如上
    return cost
cost=regularized_costfunction(theta,x,y,1)
print('initial_cost:',cost)
# 查看初始正则化代价函数值,此时lambda设为1. 0.6931471805599461
1.7 Regularized gradientfunction
def regularized_gradient(theta,x,y,l):
# 定义函数,传入参数
    h=x@theta
    g=(x.T@(sigmoid(h)-y))/len(x)
    reg=(l/len(x))*theta
    reg[0]=0
# 将reg中第一项设为0,即不对theta_{0}正则化
    gradient=g+reg
    return gradient
gradient=regularized_gradient(theta,x,y,1)
print(gradient)
# 查看初始梯度
1.8 Train model
下面就该进入训练模型阶段了:
def training():
# 定义函数
    result=opt.minimize(fun=regularized_costfunction,method='TNC',x0=theta,args=(x,y,2),jac=regularized_gradient)
# 利用minimize算法,其中第一个参数是需要优化的函数,第二个是优化方法,第三个是待优化函数里的自变量(注意该自变量一定要写在代价函数和梯度函数传入参数里的第一个位置,不然可能debug一天,别问我怎么知道的),第四个是参数,第五个是采用的梯度)
    return result
result=training()
print(result)
# 查看结果
print(result['x'])
# 查看其中最优解(也就是theta值)
fin_theta=result['x']
1.9 Visualization result
下面根据训练出的theta可视化分类结果,直观感觉效果:
def plot_boundary():
# 定义函数
    fig,ax=plt.subplots(figsize=(6,6))
# 创建画布,定义对象
    x = np.linspace(-1, 1.5, 250)
# x
    xx, yy = np.meshgrid(x, x)
# 网格
    z = feature_mapping(xx.flatten(), yy.flatten(), 6).values
# 特征映射,注意传入参数需展开为一维数组
    z = z @ result['x']
    z = z.reshape(xx.shape)
# 计算z值
    pos_data=data[data.accept.isin(['1'])]
    neg_data=data[data.accept.isin(['0'])]
    ax.scatter(pos_data['test1'],pos_data['test2'],c='r')
    ax.scatter(neg_data['test1'],neg_data['test2'],c='black')
    plt.contour(xx,yy,z,0)
# 画等高线函数
    plt.show()
#plot_boundary()
1.10 Evalute model
代码如下:
def model_predict(theta,x):
# 定义函数
    h=x@theta
    predict=sigmoid(h)
    return [1 if i>=0.5 else 0 for i in predict]
# 返回模型预测的每个样本的标签,列表形式
result=model_predict(fin_theta,x)
def model_evaluation():
# 定义函数
    accuracy=sum([1 if i==j else 0 for (i,j) in zip (result,y)])/len(x)
# 将模型预测标签与实际标签对比,相同返回1,否则0,从而计算精度
    return accuracy
accuracy=model_evaluation()
print('The accuray of the model is {}{}'.format(accuracy*100,'%'))
# 查看精度
# The accuray of the model is 80.50847457627118%
还算不错,不过也不是太高,读者可自行尝试将特征映射维度修改,从而观察精度变化。
1.11 Apply model
完成一个模型的训练和检验后,就该应用模型,下面给出代码:
a=np.array(float(input('Test1:')))
b=np.array(float(input('Test2:')))
# 获取两次测试的数据并转为浮点数
def apply_model(theta,a,b):
    feature=[]
    for i in np.arange(7):
        for p in np.arange(i + 1):
            feature.append(np.power(a, i - p) * np.power(b, p))
    #print(feature)
    # 计算a,b的高维特征
    z=feature@fin_theta
    s=sigmoid(z)
    # 计算激励函数值
    print('The probability of accpet:{}{}'.format(s*100,'%'))
    if s >=0.5:
    # 与0.5比大小从而确定结果
        print('Maybe it is OK')
    else:
        print('Rejected')

apply_model(fin_theta,a,b)
测试结果如下:


可以看到,sigmoid函数输出在0.5左右,也就是说对于正负样本,均集中在sigmoid中心区域,这就导致了模型鲁棒性差,同时也解释了为什么预测准确率只有80%。
1.12 All
最后,给出完整代码:
import numpy as np
import pandas as pd
import matplotlib.pyplot as plt
import scipy.optimize as opt
def load_data(path):
    data=pd.read_csv(path,header=None,names=['test1','test2','accept'])
    return data,data.head(),data.describe()
data,data_head,data_describe=load_data('ex2data2.txt')
#print('data_head:',data_head)
#print('data_describe:',data_describe)
def view_data():
    pos_data=data[data.accept.isin(['1'])]
    neg_data=data[data.accept.isin(['0'])]
    fig,ax=plt.subplots(figsize=(6,6))
    ax.scatter(pos_data['test1'],pos_data['test2'],c='r',label='Accpet')
    ax.scatter(neg_data['test1'],neg_data['test2'],c='black',label='Reject')
    ax.set_xlabel('Test1')
    ax.set_ylabel('Test2')
    ax.legend()
    ax.set_title('Test and Accept')
    plt.show()
#view_data()
def preprocess_data(data):
    data.insert(0,'one',1)
    x=(data.iloc[:,:-1]).values
    y=(data.iloc[:,-1]).values
    return x,y
x,y=preprocess_data(data)
#print(x.shape)
#print(y.shape)
#print('x:',x)

def feature_mapping(a, b, power):
    data_ = {}
    for i in np.arange(power + 1):
        for p in np.arange(i + 1):
            data_["x{}{}".format(i - p, p)] = np.power(a, i - p) * np.power(b, p)
    return pd.DataFrame(data_)
x_1=(data['test1']).values
#print('x_1:',x_1)
x_2=(data['test2']).values
data_new=feature_mapping(x_1,x_2,6)
print(data_new.head())
x=(data_new).values
y=(data['accept']).values
#print(x)
theta=np.zeros(x.shape[1])
print(x.shape,y.shape,theta.shape)
def sigmoid(z):
    return 1/(1+np.exp(-z))
def regularized_costfunction(theta,x,y,l):
    theta=np.zeros(x.shape[1])
    reg=theta[1:]@theta[1:]
    h=x@theta
    J=((-y)*np.log(sigmoid(h))-(1-y)*np.log(sigmoid(h)))
    cost=sum(J)/len(x)+reg*l/(2*len(x))
    return cost
cost=regularized_costfunction(theta,x,y,1)
print('initial_cost:',cost)
def regularized_gradient(theta,x,y,l):
    h=x@theta
    g=(x.T@(sigmoid(h)-y))/len(x)
    reg=(l/len(x))*theta
    reg[0]=0
    gradient=g+reg
    return gradient
gradient=regularized_gradient(theta,x,y,1)
print(gradient)
def training():
    result=opt.minimize(fun=regularized_costfunction,method='TNC',x0=theta,args=(x,y,2),jac=regularized_gradient)
    return result
result=training()
print(result)
print(result['x'])
fin_theta=result['x']
def plot_boundary():
    fig,ax=plt.subplots(figsize=(6,6))
    x = np.linspace(-1, 1.5, 250)
    xx, yy = np.meshgrid(x, x)
    z = feature_mapping(xx.flatten(), yy.flatten(), 6).values
    z = z @ result['x']
    z = z.reshape(xx.shape)
    pos_data=data[data.accept.isin(['1'])]
    neg_data=data[data.accept.isin(['0'])]
    ax.scatter(pos_data['test1'],pos_data['test2'],c='r')
    ax.scatter(neg_data['test1'],neg_data['test2'],c='black')
    plt.contour(xx,yy,z,0)
    plt.show()
#plot_boundary()
def model_predict(theta,x):
    h=x@theta
    predict=sigmoid(h)
    return [1 if i>=0.5 else 0 for i in predict]
result=model_predict(fin_theta,x)
def model_evaluation():
    accuracy=sum([1 if i==j else 0 for (i,j) in zip (result,y)])/len(x)
    return accuracy
accuracy=model_evaluation()
print('The accuray of the model is {}{}'.format(accuracy*100,'%'))
a=np.array(float(input('Test1:')))
b=np.array(float(input('Test2:')))
def apply_model(theta,a,b):
    feature=[]
    for i in np.arange(7):
        for p in np.arange(i + 1):
            feature.append(np.power(a, i - p) * np.power(b, p))
    #print(feature)
    z=feature@fin_theta
    s=sigmoid(z)
    print('The probability of accpet:{}{}'.format(s*100,'%'))
    if s >=0.5:
        print('Maybe it is OK')
    else:
        print('Rejected')

apply_model(fin_theta,a,b)
还是那句话,希望读者多加练习,反复书写,不断优化。
未经允许,请勿转载。
欢迎交流。


