线性回归中的非线性变换
非线性变换
在线性回归模型中,会发现有些变量与预测变量不是线性关系,所以需要非线性变换,把非线性关系转换为线性关系。
一、单变量做变换
载入boston房价数据
from sklearn.datasets import load_boston
from random import shuffle
boston = load_boston()
#seed(0) # Creates a replicable shuffling
#new_index = range(boston.data.shape[0])
#shuffle(new_index) # shuffling the index
#X, y = boston.data[new_index], boston.target[new_index]
X, y = boston.data, boston.target
print (X.shape, y.shape, boston.feature_names)

#散点图判断变量与目标之间的关系
import pandas as pd
df = pd.DataFrame(X,columns=boston.feature_names)
df['target'] = y
scatter = df.plot(kind='scatter', x='LSTAT', y='target', c='r')
从图中可以看出,LSTA可尝试log变换
import numpy as np
from sklearn.feature_selection.univariate_selection import f_regression
a=df['LSTAT'].values
y=boston.target
a=a.reshape(-1,1)
#注意:f_regression中的X参数和Y参数都必须是narray格式,且X必须是矩阵模式。
'''print(type(a))
print(type(y))
print(np.shape(a))
print(np.shape(y))
print(a)
print(y)'''
F, pval = f_regression(a,y)
#X_indices = np.arange(X.shape[-1])
print('F score for the original feature %.1f' % F)
F, pval = f_regression(np.log(a),y)
print('F score for the transformed feature %.1f' % F)
可以看出,log变换之后,F值变大,变换比较有效
import matplotlib.pyplot as plt
c=np.log(a)
#plt.scatter(a,y,s=[30],c='b')
plt.scatter(c,y,s=[30],c='b')
如上图,关系呈现线性。
二、除了考虑单变量,还要考虑变量之间的交互作用
#加载助手类:线性回归模型,K折交叉验证
from sklearn.linear_model import LinearRegression
from sklearn.cross_validation import cross_val_score
from sklearn.cross_validation import KFold
regression = LinearRegression(normalize=True)
crossvalidation = KFold(n=X.shape[0], n_folds=10, shuffle=True, random_state=1)
#加载波士顿房价预测数据集
from sklearn.datasets import load_boston
from random import shuffle
boston = load_boston()
X, y = boston.data, boston.target
df = pd.DataFrame(X,columns=boston.feature_names)
baseline = np.mean(cross_val_score(regression, df, y, scoring='r2', cv=crossvalidation, n_jobs=1))
#创建一个列表,该列表遍历所有的交互项(n*n次),如果加入了某个交互项的模型的k折交叉验证得分高于基准线,就会把交互项和得分存在列表中
interactions = list()
for feature_A in boston.feature_names:
for feature_B in boston.feature_names:
if feature_A > feature_B:
df['interaction'] = df[feature_A] * df[feature_B]
score = np.mean(cross_val_score(regression, df, y, scoring='r2', cv=crossvalidation, n_jobs=1))
if score > baseline:
interactions.append((feature_A, feature_B, round(score,3)))
print ('Baseline R2: %.3f' % baseline)
print ('Top 10 interactions: %s' % sorted(interactions, key=lambda x:x[2], reverse=True)[:10])
结果集如下:
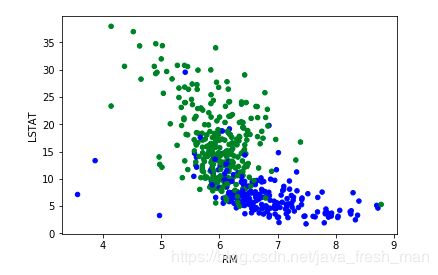
现在检测rm、lstat与房价的关系
colors = ['b' if v > np.mean(y) else 'g' for v in y]
scatter = df.plot(kind='scatter', x='RM', y='LSTAT', c=colors)
rm代表每栋房子的房间数
LSTAT代表该地区低社会地位人口占比,
综上,房间数越多、地区人口社会越高,房价越高,符合常识。
:Attribute Information (in order):
        - CRIM     per capita crime rate by town
        - ZN       proportion of residential land zoned for lots over 25,000 sq.ft.
        - INDUS    proportion of non-retail business acres per town
        - CHAS     Charles River dummy variable (= 1 if tract bounds river; 0 otherwise)
        - NOX      nitric oxides concentration (parts per 10 million)
        - RM       average number of rooms per dwelling
        - AGE      proportion of owner-occupied units built prior to 1940
        - DIS      weighted distances to five Boston employment centres
        - RAD      index of accessibility to radial highways
        - TAX      full-value property-tax rate per $10,000
        - PTRATIO  pupil-teacher ratio by town
        - B        1000(Bk - 0.63)^2 where Bk is the proportion of blacks by town
        - LSTAT    % lower status of the population
        - MEDV     Median value of owner-occupied homes in $1000's
三、多项式回归:添加二次项和相互变量
# Adding polynomial features (x**2,y**2,xy)
polyX = pd.DataFrame(X,columns=boston.feature_names)
baseline = np.mean(cross_val_score(regression, polyX, y, scoring='neg_mean_squared_error', cv=crossvalidation, n_jobs=1))
improvements = [baseline]
for feature_A in boston.feature_names:
polyX[feature_A+'^2'] = polyX[feature_A]**2
improvements.append(np.mean(cross_val_score(regression, polyX, y, scoring='neg_mean_squared_error', cv=crossvalidation, n_jobs=1)))
for feature_B in boston.feature_names:
if feature_A > feature_B:
polyX[feature_A+'*'+feature_B] = polyX[feature_A] * polyX[feature_B]
improvements.append(np.mean(cross_val_score(regression, polyX, y, scoring='neg_mean_squared_error', cv=crossvalidation, n_jobs=1)))
#作图
import matplotlib.pyplot as plt
import numpy as np
plt.figure()
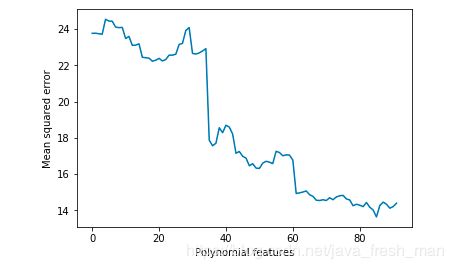
plt.plot(range(0,92),np.abs(improvements),'-')
plt.xlabel('Polynomial features')
plt.ylabel('Mean squared error')
plt.show()
#验证均方差
print(baseline)
print (np.shape(polyX))
crossvalidation = KFold(n=X.shape[0], n_folds=10, shuffle=True, random_state=1)
print ('Mean squared error %.3f' % abs(np.mean(cross_val_score(regression, polyX, y, scoring='neg_mean_squared_error', cv=crossvalidation, n_jobs=1))))
图中可以看出,多项式的特征越多不一定越好。
检查最终的模型,发现polyX有104个特征,一般对于一个特征至少需要有10-20个观察点,最好在30个以上。
此案例有506个观察点,特征点25左右比较合适。104个太多。从折线图看,20是个不错的点。
如果想获得完美的模型,需要逐一去尝试变量。


