Python 京东商品评论 词云展示
词云图是一种用来展现高频关键词的可视化表达,通过文字、色彩、图形的搭配,产生有冲击力地视觉效果,而且能够传达有价值的信息。
本文通过对京东商品评论数据进行预处理、文本分词、词频统计、词云展示,熟悉制作词云的基本方法。
1. 利用wordcloud库绘制词云
wordcloud是优秀的词云展示第三方库
可以在命令行通过pip安装
pip install wordcloud -i http://pypi.douban.com/simple --trusted-host pypi.douban.com
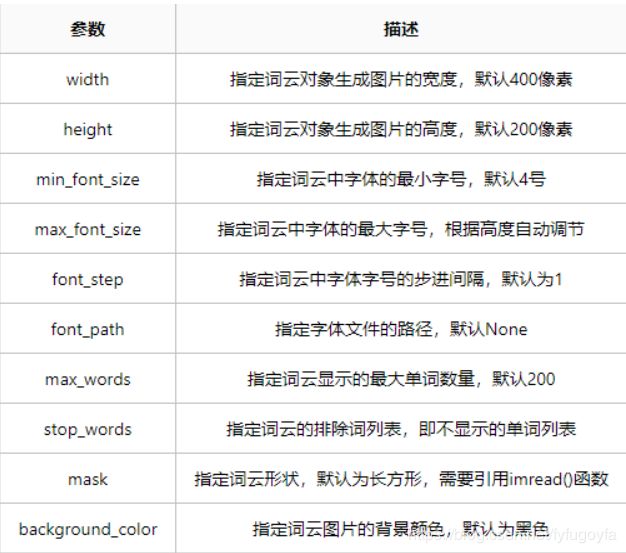
wordcloud库把词云当作一个WordCloud对象
- wordcloud.WordCloud( ) 代表一个文本对应的词云
- 可以根据文本中词语出现的频率等参数绘制词云
- 绘制词云的形状,尺寸和颜色都可以设定
import jieba
import collections
import re
from wordcloud import WordCloud
import matplotlib.pyplot as plt


# 958条评论数据
with open('data.txt') as f:
    data = f.read()

# 文本预处理  去除一些无用的字符   只提取出中文出来
new_data = re.findall('[\u4e00-\u9fa5]+', data, re.S)
new_data = " ".join(new_data)

# 文本分词
seg_list_exact = jieba.cut(new_data, cut_all=True)

result_list = []
with open('stop_words.txt', encoding='utf-8') as f:
    con = f.readlines()
    stop_words = set()
    for i in con:
        i = i.replace("\n", "")   # 去掉读取每一行数据的\n
        stop_words.add(i)

for word in seg_list_exact:
    # 设置停用词并去除单个词
    if word not in stop_words and len(word) > 1:
        result_list.append(word)
print(result_list)

# 筛选后统计
word_counts = collections.Counter(result_list)
# 获取前100最高频的词
word_counts_top100 = word_counts.most_common(100)
print(word_counts_top100)

# 绘制词云
my_cloud = WordCloud(
    background_color='white',  # 设置背景颜色  默认是black
    width=900, height=600,
    max_words=100,            # 词云显示的最大词语数量
    font_path='simhei.ttf',   # 设置字体  显示中文
    max_font_size=99,         # 设置字体最大值
    min_font_size=16,         # 设置子图最小值
    random_state=50           # 设置随机生成状态,即多少种配色方案
).generate_from_frequencies(word_counts)

# 显示生成的词云图片
plt.imshow(my_cloud, interpolation='bilinear')
# 显示设置词云图中无坐标轴
plt.axis('off')
plt.show()
2. 利用pyecharts的WordCloud绘制词云
pyecharts是基于echarts的python库,能够绘制多种交互式图表,和其他可视化库不一样,pyecharts支持链式调用。
也就是说添加图表元素、修改图表配置,只需要简单的调用组件即可。
# class pyecharts.charts.WordCloud
class WordCloud(
    # 初始化配置项,参考 `global_options.InitOpts`
    init_opts: opts.InitOpts = opts.InitOpts()
)
# func pyecharts.charts.WordCloud.add
def add(
    # 系列名称,用于 tooltip 的显示,legend 的图例筛选。
    series_name: str,

    # 系列数据项,[(word1, count1), (word2, count2)]
    data_pair: Sequence,

    # 词云图轮廓,有 'circle', 'cardioid', 'diamond', 'triangle-forward', 'triangle', 'pentagon', 'star' 可选
    shape: str = "circle",

    # 自定义的图片(目前支持 jpg, jpeg, png, ico 的格式,其他的图片格式待测试)
    # 该参数支持:
    # 1、 base64 (需要补充 data 头);
    # 2、本地文件路径(相对或者绝对路径都可以)
    # 注:如果使用了 mask_image 之后第一次渲染会出现空白的情况,再刷新一次就可以了(Echarts 的问题)
    # Echarts Issue: https://github.com/ecomfe/echarts-wordcloud/issues/74
    mask_image: types.Optional[str] = None,

    # 单词间隔
    word_gap: Numeric = 20,

    # 单词字体大小范围
    word_size_range=None,

    # 旋转单词角度
    rotate_step: Numeric = 45,

    # 距离左侧的距离
    pos_left: types.Optional[str] = None,

    # 距离顶部的距离
    pos_top: types.Optional[str] = None,

    # 距离右侧的距离
    pos_right: types.Optional[str] = None,

    # 距离底部的距离
    pos_bottom: types.Optional[str] = None,

    # 词云图的宽度
    width: types.Optional[str] = None,

    # 词云图的高度
    height: types.Optional[str] = None,

    # 允许词云图的数据展示在画布范围之外
    is_draw_out_of_bound: bool = False,

    # 提示框组件配置项,参考 `series_options.TooltipOpts`
    tooltip_opts: Union[opts.TooltipOpts, dict, None] = None,

    # 词云图文字的配置
    textstyle_opts: types.TextStyle = None,

    # 词云图文字阴影的范围
    emphasis_shadow_blur: types.Optional[types.Numeric] = None,

    # 词云图文字阴影的颜色
    emphasis_shadow_color: types.Optional[str] = None,
)
代码实现:
import jieba
import collections
import re
from pyecharts.charts import WordCloud
from pyecharts.globals import SymbolType
from pyecharts import options as opts
from pyecharts.globals import ThemeType, CurrentConfig


CurrentConfig.ONLINE_HOST = 'D:/python/pyecharts-assets-master/assets/'

# 958条评论数据
with open('data.txt') as f:
    data = f.read()

# 文本预处理  去除一些无用的字符   只提取出中文出来
new_data = re.findall('[\u4e00-\u9fa5]+', data, re.S)  # 只要字符串中的中文
new_data = " ".join(new_data)

# 文本分词--精确模式分词
seg_list_exact = jieba.cut(new_data, cut_all=True)

result_list = []
with open('stop_words.txt', encoding='utf-8') as f:
    con = f.readlines()
    stop_words = set()
    for i in con:
        i = i.replace("\n", "")   # 去掉读取每一行数据的\n
        stop_words.add(i)

for word in seg_list_exact:
    # 设置停用词并去除单个词
    if word not in stop_words and len(word) > 1:
        result_list.append(word)
print(result_list)


# 筛选后统计
word_counts = collections.Counter(result_list)
# 获取前100最高频的词
word_counts_top100 = word_counts.most_common(100)
# 可以打印出来看看统计的词频
print(word_counts_top100)

word1 = WordCloud(init_opts=opts.InitOpts(width='1350px', height='750px', theme=ThemeType.MACARONS))
word1.add('词频', data_pair=word_counts_top100,
          word_size_range=[15, 108], textstyle_opts=opts.TextStyleOpts(font_family='cursive'),
          shape=SymbolType.DIAMOND)
word1.set_global_opts(title_opts=opts.TitleOpts('商品评论词云图'),
                      toolbox_opts=opts.ToolboxOpts(is_show=True, orient='vertical'),
                      tooltip_opts=opts.TooltipOpts(is_show=True, background_color='red', border_color='yellow'))
word1.render("商品评论词云图.html")


