文章目录
- MLP
- MLP的向量形式:
- MLP的损失函数:
- 感知机求∂L/∂w:
- 实现
- 验证
- 辅助函数
MLP
MLP的向量形式:

MLP的损失函数:

感知机求∂L/∂w:

实现
import numpy as np
import matplotlib.pyplot as plt
class MultiPerceptron:
def __init__(self):
self._w = None
def fit(self, x, y, lr=1e-3, epoch=1000):
x = np.asarray(x, np.float32)
y = np.asarray(y, np.float32)
self._w = np.zeros([x.shape[1],y.shape[1]])
for _ in range(epoch):
y_pred = x.dot(self._w)
dw = 2*x.T.dot(y_pred - y)
self._w -= lr*dw
def predict(self,x):
y_pred = np.asarray(x, np.float32).dot(self._w)
return np.argmax(y_pred, axis=1).astype(np.float32)
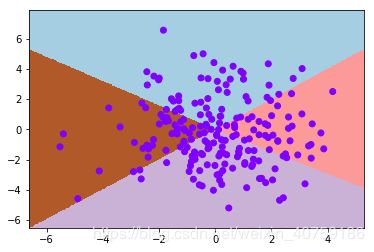
验证
x, y = gen_five_clusters()
label = np.argmax(y, axis=1)
perceptron = MultiPerceptron()
perceptron.fit(x,y)
visualize2d(perceptron,x,label,draw_background=True)
print("Acc: {:8.6} %".format((perceptron.predict(x) == label).mean()*100))

辅助函数
import numpy as np
import matplotlib.pyplot as plt

from math import pi

def gen_five_clusters(size=200):
    x = np.random.randn(size) * 2
    y = np.random.randn(size) * 2
    z = np.full(size, -1)
    mask1, mask2 = x + y >= 1, x + y >= -1
    mask3, mask4 = x - y >= 1, x - y >= -1
    z[mask1 & ~mask4] = 0
    z[mask1 & mask3] = 1
    z[~mask2 & mask3] = 2
    z[~mask2 & ~mask4] = 3
    z[z == -1] = 4
    one_hot = np.zeros([size, 5])
    one_hot[range(size), z] = 1
    return np.c_[x, y].astype(np.float32), one_hot

def visualize2d(clf, x, y, padding=0.2, draw_background=False):
    axis, labels = np.array(x).T, np.array(y)

    nx, ny, padding = 400, 400, padding
    x_min, x_max = np.min(axis[0]), np.max(axis[0])
    y_min, y_max = np.min(axis[1]), np.max(axis[1])
    x_padding = max(abs(x_min), abs(x_max)) * padding
    y_padding = max(abs(y_min), abs(y_max)) * padding
    x_min -= x_padding
    x_max += x_padding
    y_min -= y_padding
    y_max += y_padding

    def get_base(nx, ny):
        xf = np.linspace(x_min, x_max, nx)
        yf = np.linspace(y_min, y_max, ny)
        n_xf, n_yf = np.meshgrid(xf, yf)
        return xf, yf, np.c_[n_xf.ravel(), n_yf.ravel()]

    xf, yf, base_matrix = get_base(nx, ny)
    z = clf.predict(base_matrix).reshape([nx, ny])

    n_label = len(np.unique(labels))
    xy_xf, xy_yf = np.meshgrid(xf, yf, sparse=True)
    colors = plt.cm.rainbow([i / n_label for i in range(n_label)])[labels.astype(np.int)]

    plt.figure()
    if draw_background:
        plt.pcolormesh(xy_xf, xy_yf, z, cmap=plt.cm.Paired)
    else:
        plt.contour(xf, yf, z, c='k-', levels=[0])
    plt.scatter(axis[0], axis[1], c=colors)
    plt.xlim(x_min, x_max)
    plt.ylim(y_min, y_max)
    plt.show()
![]()
![]()
