mapboxGL中sprite生成与引用
概述
用过mapboxGL的都知道里面有个叫做sprite的配置,它的主要用途就是地图上渲染图标的,但是大多数情况下我们需要自定义图标的,我们该怎么办呢,莫着急,牛老师有招,本文告诉你如何通过几行简单的java代码实现,用引用到我们的地图中。
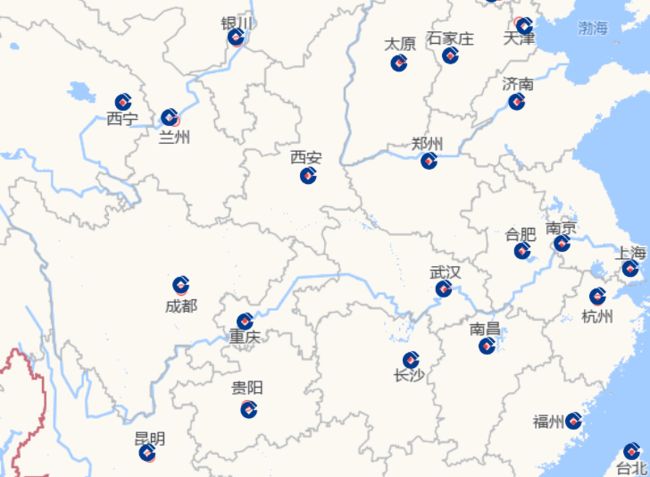
效果
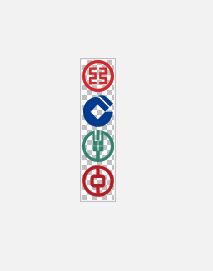
生成的json文件如下:
{
    "zgyh": {
        "visible": "true",
        "pixelRatio": 1,
        "x": 0,
        "width": 32,
        "y": 105,
        "height": 32
    },
    "jsyh": {
        "visible": "true",
        "pixelRatio": 1,
        "x": 0,
        "width": 32,
        "y": 35,
        "height": 32
    },
    "nyyh": {
        "visible": "true",
        "pixelRatio": 1,
        "x": 0,
        "width": 32,
        "y": 70,
        "height": 32
    },
    "gsyh": {
        "visible": "true",
        "pixelRatio": 1,
        "x": 0,
        "width": 32,
        "y": 0,
        "height": 32
    }
}
实现
1.图片准备
为了简单测试效果,本文的图标都是从iconfont下载的,同时为了方便,图标大小统一为32px。
2.java生成雪碧图和json
import java.awt.*;
import java.awt.image.BufferedImage;
import java.io.*;

import com.amazonaws.util.json.JSONObject;
import javax.imageio.ImageIO;

public class MergeImg {

    public static File[] getFiles(String path) {
        File file = new File(path);
        if(file.isDirectory()) {
            File[] files = file.listFiles();
            return files;
        } else {
            return null;
        }
    }

    public static void append2File(String file, String content) {
        try {
            File f = new File(file);
            FileWriter fw = new FileWriter(f, true);
            PrintWriter pw = new PrintWriter(fw);
            pw.println(content);
            pw.flush();
            fw.flush();
            pw.close();
            fw.close();
        }
        catch (IOException e) {
            e.printStackTrace();
        }
    }

    public static void main(String[] args) throws Exception {
        String path = "D:\\lzugis\\code\\lzugis\\out";
        File[] files = getFiles(path + "\\img");
        int width = 32;
        int height = 35 * files.length;
        BufferedImage bufferedImage = new BufferedImage(width, height, BufferedImage.TYPE_INT_RGB);
        Graphics2D graphics2D = (Graphics2D) bufferedImage.getGraphics();
        bufferedImage = graphics2D.getDeviceConfiguration().createCompatibleImage(width, height, Transparency.TRANSLUCENT);
        graphics2D.dispose();
        graphics2D = bufferedImage.createGraphics();
        JSONObject jsonObject = new JSONObject();
        for (int i = 0; i < files.length; i++) {
            File file = files[i];
            if(!file.isDirectory()) {
                String name = file.getName();
                name = name.substring(0, name.lastIndexOf("."));
                BufferedImage bi = ImageIO.read(file);
                int x = 0;
                int y = 35 * i;
                int h = bi.getHeight();
                int w = bi.getWidth();
                graphics2D.drawImage(bi, x, y, w, h, null);
                JSONObject js = new JSONObject();
                js.put("x", x);
                js.put("y", y);
                js.put("width", w);
                js.put("height", h);
                js.put("pixelRatio", 1);
                js.put("visible", "true");
                jsonObject.put(name, js);
            }
        }
        graphics2D.dispose();
        FileOutputStream out = new FileOutputStream(path +"\\merge.png");
        ImageIO.write(bufferedImage, "PNG", out);
        append2File(path +"\\merge.json", jsonObject.toString());
    }
}
3.地图调用
地图调用的方式如下:
initMap: function() {
  var rootPath = 'http://localhost:63342/learn-demo/mapbox/lib/';
  var mapStyle = {
    "version": 8,
    "name": "Dark",
    "sources": {
      "XYZTile": {
        "type": "raster",
        "tiles": ['http://webrd01.is.autonavi.com/appmaptile?x={x}&y={y}&z={z}&lang=zh_cn&size=1&scale=1&style=8'],
        "tileSize": 256,
      }
    },
    "sprite": rootPath + "merge",
    "layers": [{
        "id": "background",
        "type": "background",
        "paint": {
          "background-color": "#111"
        }
      },
      {
        "id": "XYZTile",
        "type": "raster",
        "source": "XYZTile",
        "minzoom": 0,
        "maxzoom": 22
      }
    ]
  };

  map = new mapboxgl.Map({
    container: 'map',
    maxZoom: 18,
    minZoom: 0,
    zoom: 3,
    center: [109.1699, 45.9719],
    style: mapStyle,
    attributionControl: false
  });

  map.on('load', function() {
    that.addMarkers();
  });
},
addMarkers() {
  $.get('../data/capital.json', res => {
    var geojson = {
      'type': 'FeatureCollection',
      'features': []
    };
    for (var i = 0; i < res.length; i++) {
      const r = res[i];
      geojson.features.push({
        type: 'Feature',
        geometry: {
          type: 'Point',
          coordinates: [r.lon, r.lat]
        },
        properties: r
      });
    }
    that.addGeojson(geojson);
  })
},
addGeojson(geojson) {
  map.addSource('points', {
    type: 'geojson',
    data: geojson
  });
  map.addLayer({
    'id': 'points',
    'type': 'symbol',
    'source': 'points',
   'layout': {
      'icon-image': 'jsyh',
      'icon-size': [
        'interpolate',
        ['linear'],
        ['zoom'],
        4, 0.6,
        8, 0.9,
        12, 1.2
      ]
    }
  });
}

