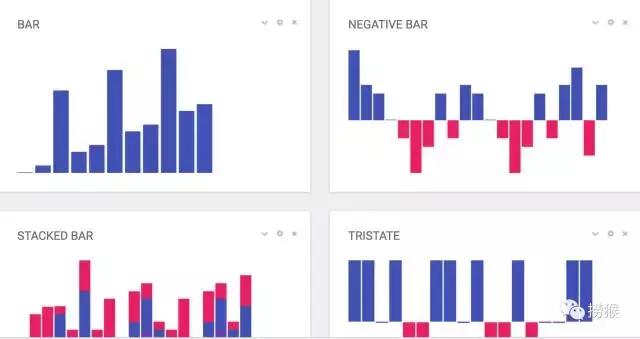
Web前端最流行图表显示组件
echarts
评价: 5星(国产组件,达到这种高度,不多)
官网: http://echarts.baidu.com/
说明: ECharts,一个纯 Javascript 的图表库,可以流畅的运行在 PC 和移动设备上,兼容当前绝大部分浏览器(IE8/9/10/11,Chrome,Firefox,Safari等),底层依赖轻量级的 Canvas 类库 ZRender,提供直观,生动,可交互,可高度个性化定制的数据可视化图表。ECharts 3 中更是加入了更多丰富的交互功能以及更多的可视化效果,并且对移动端做了深度的优化。
教程: http://echarts.baidu.com/tutorial.html#ECharts 特性介绍
demo: http://echarts.baidu.com/demo.html#bubble-gradient
源码: https://github.com/ecomfe/echarts
http://echarts.baidu.com/echarts2/doc/example.html
基于各种语言的例子:https://github.com/ecomfe/echarts
rickshaw
官网:
http://code.shutterstock.com/rickshaw/ 这个地址不,打不开
https://github.com/shutterstock/rickshaw
说明: Rickshaw 是一个用于绘制时序图的简单 jS 库,基于 Mike Bostock’s delightful D3 库构建
demo: https://github.com/shutterstock/rickshaw/tree/master/examples
sparkline
官网:
http://omnipotent.net/jquery.sparkline/
http://www.highcharts.com/
说明: sparkline是一类信息体积小和数据密度高的图表。目前它被用作一些测量,相关的变化的信息呈现的方式,如平均温度,股市交投活跃。sparkline常常以一组多条的形式出现在柱状图,折线图当中。
Demo: http://www.highcharts.com/demo/sparkline
flot-chart
官网: http://www.flotcharts.org/
说明: Flot is a pure JavaScript plotting library for jQuery, with a focus on simple usage, attractive looks and interactive features.
Demo: http://www.flotcharts.org/flot/examples/
学习资源
http://www.jqueryflottutorial.com/jquery-flot-chart-types.html
源码: https://github.com/flot/flot
实例源码: https://github.com/flot/flot/tree/master/examples
easypiechart
官网: https://github.com/rendro/easy-pie-chart/
说明:EASY PIE CHART是一个轻量级的jQuery插件,主要用来渲染和制作漂亮的饼图及动画效果,基于与HTML5的canvas元素。
Demo: https://github.com/rendro/easy-pie-chart/tree/master/demo
Chart.js
官网:http://chartjs.org/
说明: Chart.js是一个基于HTML5 canvas技术的开源图表绘制工具库。Chart.js简化了在网站上绘制动态图表的工作。
文档: http://www.chartjs.org/docs/
中文文档: http://www.bootcss.com/p/chart.js/docs/
Knob Charts
官网: http://anthonyterrien.com/knob/
说明: 一款生成超酷的旋钮特效的工具库
Demo: http://anthonyterrien.com/demo/knob/
morris.js
官网: http://morrisjs.github.io/morris.js/
说明: Morris.js 是一个轻量级的JS库,用来生成各种时序图和区域图
源码: https://github.com/morrisjs/morris.js/
Demo: https://github.com/morrisjs/morris.js/tree/master/examples


