用神经网络做传统模式识别(Car-Evaluation-Dataset)
神经网络分类器
本实验基于UCI的Car-Evaluation-Dataset进行,这是一个离散特征,数据分布平衡且无缺失值的非常舒服的数据集。
导入
import numpy as np
import pandas as pd

import matplotlib.pyplot as plt
import seaborn as sns

%time data = pd.read_csv('car_evaluation.csv', header = None)

print("Shape of the Data: ", data.shape )

# Assigning names to the columns in the dataset

data.columns = ['Price', 'Maintenance Cost', 'Number of Doors', 'Capacity', 'Size of Luggage Boot', 'safety', 'Decision']
速览
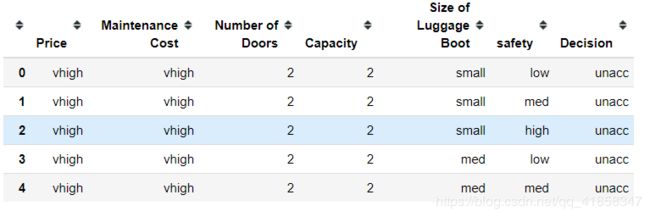
data.head()
data.info()

RangeIndex: 1728 entries, 0 to 1727
Data columns (total 7 columns):
Price                   1728 non-null object
Maintenance Cost        1728 non-null object
Number of Doors         1728 non-null object
Capacity                1728 non-null object
Size of Luggage Boot    1728 non-null object
safety                  1728 non-null object
Decision                1728 non-null object
dtypes: object(7)
memory usage: 94.6+ KB
data.describe()
EDA
labels = ['acc', 'good', 'unacc', 'vgood']
colors = ['pink', 'lightblue', 'lightgreen', 'magenta']
size = [384, 69, 1210, 65]
explode = [0.1, 0.1, 0.1, 0.1]

plt.rcParams['figure.figsize'] = (10, 10)
plt.pie(size, labels = labels, colors = colors, explode = explode, shadow = True, autopct = "%.2f%%")
plt.title('A Pie Chart Representing Different Decisions', fontsize = 20)
plt.axis('off')
plt.legend()
plt.show()
plt.rcParams['figure.figsize'] = (12, 8)
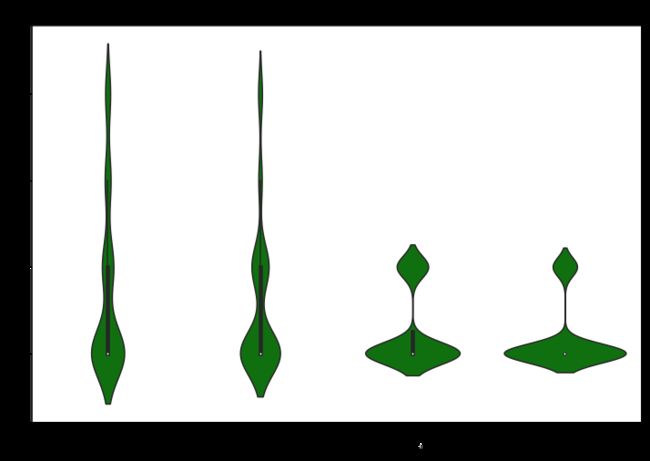
ax = sns.violinplot(x = data['Price'], y = data['Decision'], color = 'g')
ax.set_title('Violin Plot to show relation between Price and Decision', fontsize = 20)
ax.set_xlabel('Price in Increasing range', fontsize = 15)
ax.set_ylabel('Decision in Positive vibe')
plt.show()
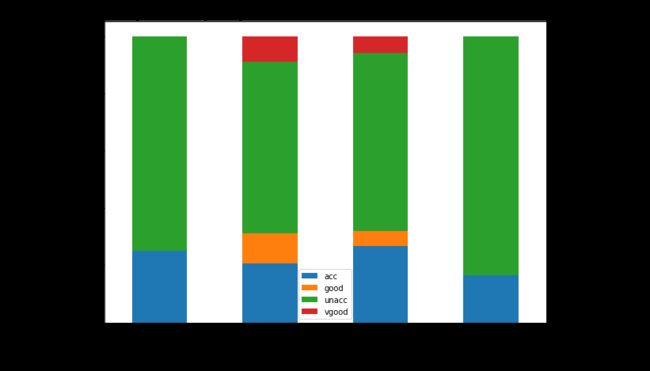
price = pd.crosstab(data['Price'], data['Decision'])
price.div(price.sum(1).astype(float), axis = 0).plot(kind = 'bar', stacked = True, figsize = (10, 7))

plt.title('Stacked Bar Graph to Depict portions of Decisions taken on each Price Category', fontsize = 20)
plt.xlabel('Price Range in Increasing Order', fontsize = 15)
plt.ylabel('Count', fontsize = 15)
plt.legend()
plt.show()
One-hot编码和DataLoader使用
y = data.values[:,-1].copy()
X = data.values[:,:-1].copy()
onehotencoder = OneHotEncoder()
X = onehotencoder.fit_transform(X).toarray()
labelencoder = LabelEncoder()
y = labelencoder.fit_transform(y)

X = torch.FloatTensor(X)
y = torch.LongTensor(y)

from sklearn.model_selection import train_test_split
X_train, X_test, y_train, y_test = train_test_split( X , y , test_size = 0.2, random_state = 1)

train_set = TensorDataset(X_train,y_train)
train_loader = DataLoader(dataset=train_set, batch_size=100, shuffle=True)

test_set = TensorDataset(X_test,y_test)
test_loader = DataLoader(dataset=test_set, batch_size=100, shuffle=True)
模型和训练
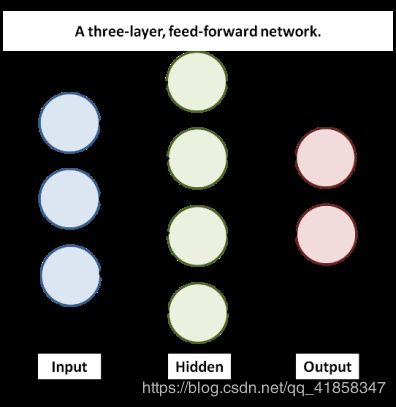
使用简单的的MLP模型,隐层神经元是输入维度的2倍,激活函数使用Tanh,损失函数使用交叉熵,优化器用Adam。

额外的,我们希望使用简单的正则化帮助网络避免过拟合,在Pytorch中,我们只需要在优化器那里增加一项weight decay即可。
input_sz = X.shape[1]
hidden_sz = input_sz*2
output_sz = y.max().item()+1
print('input size: %d, hidden size: %d, output size: %d'%(
input_sz,hidden_sz,output_sz))

model = nn.Sequential(
    nn.Linear(input_sz,hidden_sz),
    nn.Tanh(),
    nn.Linear(hidden_sz,output_sz)
)

optimizer = torch.optim.Adam(model.parameters(), lr=0.05,weight_decay=1e-5)
loss_func = nn.CrossEntropyLoss()
num_epochs = 120

train_loss = []
test_loss = []

def test_evaluate():
    Loss = 0.
    for step, (x, y) in enumerate(test_loader):
        y_pred = model(x)
        loss = loss_func(y_pred, y)
        Loss += loss.item()
    Loss /= (step+1)
    test_loss.append(Loss)
    print("loss on test set: %.2f"%(Loss))

for epoch in range(num_epochs):
    Loss = 0.
    for step, (x, y) in enumerate(train_loader):
        y_pred = model(x)
        loss = loss_func(y_pred, y)
        optimizer.zero_grad()
        loss.backward()
        Loss += loss.item()
        optimizer.step()
    Loss /= (step+1)
    train_loss.append(Loss)
    if (epoch+1)%10==0:
        test_evaluate()
        print("epoch %d, training loss %.2f"%(epoch+1,Loss))

# Loss curve
plt.plot(train_loss,c='black')
plt.title('Train loss')
plt.show()

# Accuracy curve
plt.plot(test_loss,c='black')
plt.title('Test loss')
plt.show()
true = 0
total = 0
for step, (x, y_true) in enumerate(test_loader):
    out = model(x)
    y_pred = torch.argmax(out,dim = 1)
    true += (y_pred==y_true).sum()
    total += len(y_true)

acc = true.item()/total
print("accuracy on test set: %.2f%%"%(acc*100))

accuracy on test set: 100.00%
很高兴地看到正确率拉满,MLP的能力在数据集够大,数据纯净程度够好时,表现将会比传统方法更好(SVM只有95%+正确率,使用随机森林才能让正确率逼近99%)。
小结
神经网络在数据量非常大的时候常常有着比较好的效果,只要我们控制好神经网络的过拟合,它将能发挥和传统机器学习方法相当,甚至超越传统方法的能力。
神经网络在传统模式识别上的缺点是可解释性差,因此神经网络在业务中的使用还是饱受质疑。


