通过鸢尾花数据集演示PCA操作
主要内容:通过构造协方差矩阵,计算保持原有数据95%特征信息所需要的特征数 ,通过PCA降维构造新的数据集
#通过鸢尾花数据集演示PCA操作
import pandas as pd
from sklearn.datasets import load_iris
import numpy as np
iris = load_iris()
X, y = iris.data, iris.target
df = pd.DataFrame(np.hstack((X, y.reshape(-1, 1))),index = range(X.shape[0]),columns=['sepal_len','sepal_wid','petal_len','petal_wid','class'] )
# print(df['class'].value_counts())
#
# X = df.ix[:,0:4].values
# y = df.ix[:,4].values

from matplotlib import pyplot as plt
# import math
#
label_dict = {0:'Iris-Setosa',
              1:'Iris-Versicolor',
              2:'Iris-Virgnica'
              }
# feature_dict = {0:'sepal length [cm]',
#                 1:'sepal width [cm]',
#                 2:'petal length [cm]',
#                 3:'petal width [cm]'}
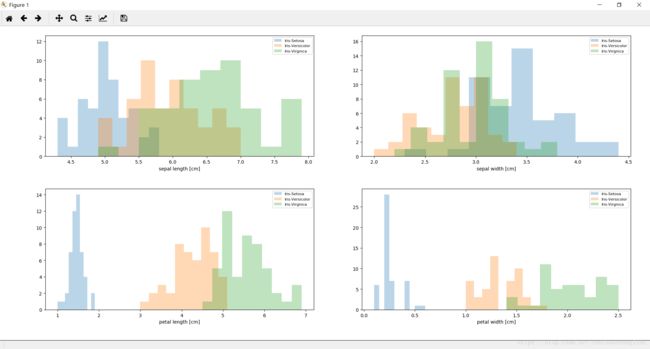
# plt.figure(figsize=(8,6))
# for cnt in range(4):
#     plt.subplot(2, 2, cnt+1)
#     for lab in label_dict.keys():
#         plt.hist(X[y==lab, cnt],
#                  label=label_dict[lab],
#                  bins=10,
#                  alpha=0.3,)
#     plt.xlabel(feature_dict[cnt])
#     plt.legend(loc='upper right', fancybox=True, fontsize=8)
# plt.tight_layout()
# plt.show()

from sklearn.preprocessing import StandardScaler
X_std = StandardScaler().fit_transform(X)

# print(X_std.shape) 150 *4
#计算协方差矩阵方法1
mean_vec = np.mean(X_std,axis = 0)
cov_mat = (X_std - mean_vec).T.dot((X_std - mean_vec)) / (X_std.shape[0]-1)
# print(cov_mat.shape) 4*4
# print('Covariance matrix \n%s' %cov_mat)

#计算协方差矩阵方法2 numpy方法
cov_mat = np.cov(X_std.T)
# print('NumPy covariance matrix: \n%s' %cov_mat)
#构造特征值 特征矩阵
eig_vals,eig_vecs = np.linalg.eig(cov_mat)
# print('Eigenvectors \n%s' %eig_vecs)
# print('\nEigenvalues \n%s' %eig_vals)

#查看多少个特征 能保证原始数据的90%信息
eig_pairs = [(np.abs(eig_vals[i]),eig_vecs[:,i]) for i in range(len(eig_vals))]
# print(eig_pairs)
# print('--------')
eig_pairs.sort(key = lambda x:x[0],reverse = True)
# print('Eigenvalues in descending order:')
# for i in eig_pairs:
#     print(i)
tot = sum(eig_vals)
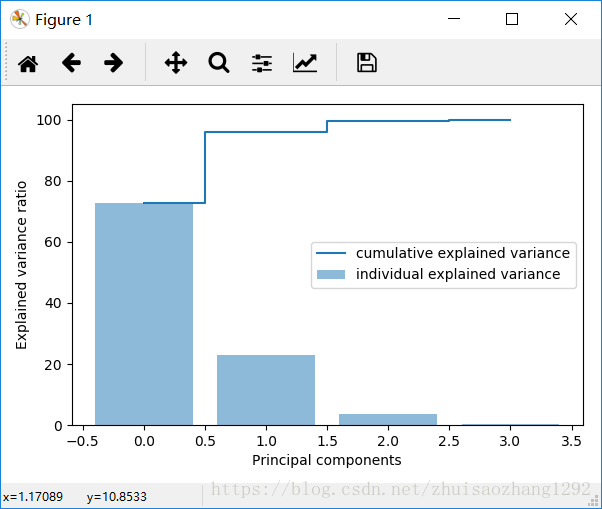
var_exp = [(i/tot)*100 for i in sorted(eig_vals,reverse = True)] #换算成百分比 因为这样能知道到底需要几个特征 能反应原始数据90%的信息
# print(var_exp) #[72.77045209380137, 23.030523267680636, 3.6838319576273824, 0.515192680890629]
cum_var_exp = np.cumsum(var_exp) #累计和
# print(cum_var_exp) #[ 72.77045209  95.80097536  99.48480732 100.        ]
#绘制比例曲线
# plt.figure(figsize = (6,4))
# plt.bar(range(4),var_exp,alpha = 0.5,align = 'center',label = 'individual explained variance') #显示柱状图
# plt.step(range(4),cum_var_exp,where = 'mid',label = 'cumulative explained variance') #显示阶跃图
# plt.ylabel('Explained variance ratio')
# plt.xlabel('Principal components')
# plt.legend(loc = 'best') #显示图例
# plt.tight_layout()
# plt.show()
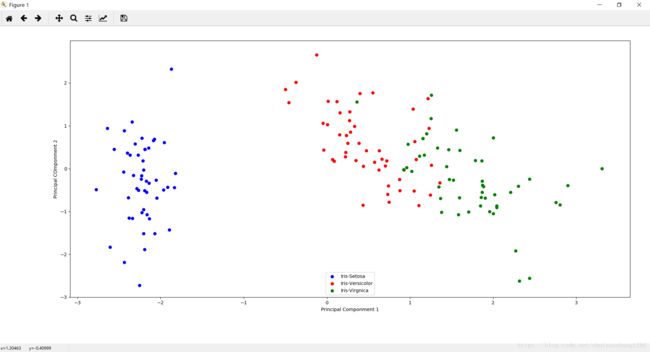
#提取了最重要的两个特征 保证了原始95%的有效信息
matrix_w = np.hstack((eig_pairs[0][1].reshape(4,1),
                      eig_pairs[1][1].reshape(4,1)))
# print('Matrix W:\n',matrix_w)

Y = X_std.dot(matrix_w)
# print(Y.shape) #(150, 2)
plt.figure(figsize=(6,4))
for lab,col in zip(label_dict.keys(),('blue','red','green')):
    plt.scatter(Y[y == lab,0],
                Y[y == lab,1],
                label = label_dict[lab],
                c = col)
plt.xlabel('Principal Componment 1')
plt.ylabel('Principal COmponment 2')
plt.legend(loc = 'lower center')
plt.tight_layout()
plt.show()

