【机器学习(3)】多元线性回归代码实现
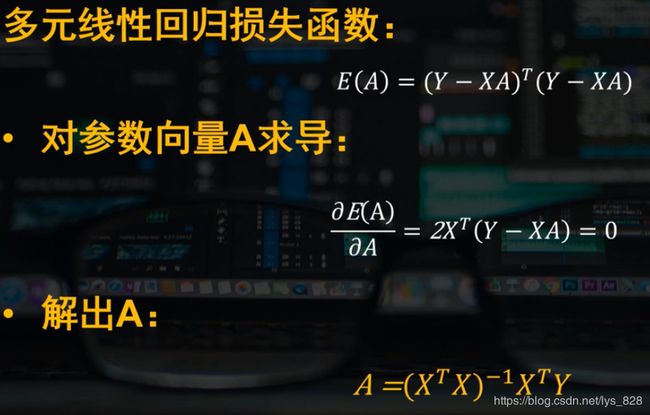
如何求解A
代码实现
- 前期准备
#导入相关库
import pandas as pd
import numpy as np

# 读取样例数据并产看数据维度
df = pd.read_excel('sample_data_sets.xlsx')
print(df.columns)
print(df.shape)
–> 输出结果为:
Index([‘id’, ‘complete_year’, ‘average_price’, ‘area’, ‘daypop’, ‘nightpop’,
‘night20-39’, ‘sub_kde’, ‘bus_kde’, ‘kind_kde’], dtype=‘object’)
(1000, 10)
- 提取自变量和因变量
# 提取自变量
x_df = df[['area','daypop']].reset_index(drop = True)
print(x_df.shape)
print(x_df.head())
–> 输出结果为:
(1000, 2)
area daypop
0 64.80 182.200730
1 58.41 182.216687
2 54.25 182.216687
3 80.50 129.981848
4 98.10 166.881445
# 提取因变量(是一维的,输出为series结构)
y_df = df['average_price'].reset_index(drop = True)
print(y_df.shape)
print(y_df.head())
–> 输出结果为:
(1000,)
0 18982
1 13697
2 15024
3 11181
4 17228
Name: average_price, dtype: int64
- 公式的向量转化
# 令x0 = 1
# 方便之后将参数b转换成x0*a0
x_df['x0'] = 1
print(x_df.shape)
print(x_df.head())
–> 输出结果为:
(1000, 3)
area daypop x0
0 64.80 182.200730 1
1 58.41 182.216687 1
2 54.25 182.216687 1
3 80.50 129.981848 1
4 98.10 166.881445 1
# 将自变量、因变量转换成矩阵形式
x_array = np.array(x_df)
print(x_array.shape)
xmatrix = np.mat(x_array)
print(xmatrix.shape)
–> 输出结果为:
(1000, 3)
(1000, 3)
#将y转换成列为1的矩阵:
y_array = np.array(y_df)
print(y_array.shape)
ymatrix = np.mat(y_array).T
print(ymatrix.shape)
–> 输出结果为:
(1000,)
(1000, 1)
- 计算X与X的转置的乘积
xTx = xmatrix.T * xmatrix
print(xTx.shape)
–> 输出结果为:
(3, 3)
- 求解逆矩阵
矩阵在求其可逆矩阵之前,要先进行判断xTx是否是非奇异的,否则无法进行求解
if np.linalg.det(xTx) == 0:
    print('对称矩阵非奇异')
else:
    print('矩阵可逆')
–> 输出结果为:
矩阵可逆
# 如果对称矩阵不是非奇异的
# 计算xTx的逆矩阵
xTxI = xTx.I
print(xTxI.shape)
–> 输出结果为:
(3, 3)
- 求解A向量
# 估计参数
A = xTxI * xmatrix.T * ymatrix
print(A)
print(A.shape)
–> 输出结果为:
[[2.84011593e+01]
[3.34173194e+00]
[2.58619885e+04]]
(3, 1)
- 模型预测
# 使用参数A计算预测值y
y_predict = xmatrix*A
print(y_predict.head())
print(y_predict.shape)
–> 输出结果为:
[[28311.24962997]
[28129.8195476 ]
[28011.67072507]
[28582.64632639]
[29205.8152903 ]]
(1000, 1)
